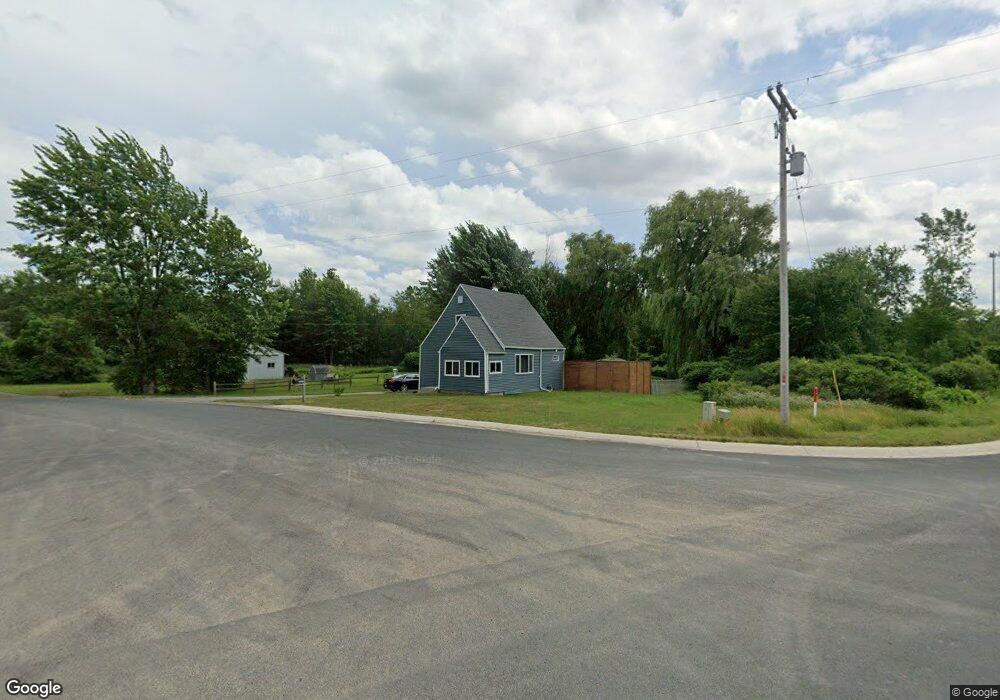
5362 Egner St Cedar Springs, MI 49319
Estimated Value: $192,000 - $268,000
3
Beds
1
Bath
1,004
Sq Ft
$216/Sq Ft
Est. Value
About This Home
This home is located at 5362 Egner St, Cedar Springs, MI 49319 and is currently estimated at $216,371, approximately $215 per square foot. 5362 Egner St is a home located in Kent County with nearby schools including Cedar Trails Elementary School, Red Hawk Intermediate School, and Beach Elementary School.
Ownership History
Date
Name
Owned For
Owner Type
Purchase Details
Closed on
Feb 10, 2023
Sold by
Guarisco Kurt
Bought by
Church Emily J and Church Evan M
Current Estimated Value
Home Financials for this Owner
Home Financials are based on the most recent Mortgage that was taken out on this home.
Original Mortgage
$156,750
Outstanding Balance
$151,832
Interest Rate
6.33%
Mortgage Type
New Conventional
Estimated Equity
$64,539
Purchase Details
Closed on
Aug 31, 2016
Sold by
Badgerow Preston M
Bought by
Guarisco Jennifer Marie
Purchase Details
Closed on
Aug 25, 2010
Sold by
Fannie Mae
Bought by
Guarisco Kurt and Badgerow Preston M
Purchase Details
Closed on
Feb 3, 2010
Sold by
Bac Home Loans Servicing Lp
Bought by
Federal National Mortgage Association
Purchase Details
Closed on
Dec 23, 2009
Sold by
Hilgendorf Odel H and Hilgendorf Francine M
Bought by
Bac Home Loans Servicing Lp
Purchase Details
Closed on
Jun 2, 1993
Create a Home Valuation Report for This Property
The Home Valuation Report is an in-depth analysis detailing your home's value as well as a comparison with similar homes in the area
Home Values in the Area
Average Home Value in this Area
Purchase History
| Date | Buyer | Sale Price | Title Company |
|---|---|---|---|
| Church Emily J | $165,000 | Independent Title Services | |
| Guarisco Jennifer Marie | -- | None Available | |
| Guarisco Kurt | $23,100 | Multiple | |
| Federal National Mortgage Association | -- | None Available | |
| Bac Home Loans Servicing Lp | $78,739 | None Available | |
| -- | $42,900 | -- |
Source: Public Records
Mortgage History
| Date | Status | Borrower | Loan Amount |
|---|---|---|---|
| Open | Church Emily J | $156,750 |
Source: Public Records
Tax History Compared to Growth
Tax History
| Year | Tax Paid | Tax Assessment Tax Assessment Total Assessment is a certain percentage of the fair market value that is determined by local assessors to be the total taxable value of land and additions on the property. | Land | Improvement |
|---|---|---|---|---|
| 2025 | $1,151 | $49,800 | $0 | $0 |
| 2024 | $1,151 | $47,100 | $0 | $0 |
| 2023 | $838 | $40,800 | $0 | $0 |
| 2022 | $798 | $36,600 | $0 | $0 |
| 2021 | $964 | $36,900 | $0 | $0 |
| 2020 | $800 | $36,500 | $0 | $0 |
| 2019 | $942 | $34,300 | $0 | $0 |
| 2018 | $923 | $32,000 | $0 | $0 |
| 2017 | $1,558 | $29,400 | $0 | $0 |
| 2016 | $0 | $28,800 | $0 | $0 |
| 2015 | -- | $28,800 | $0 | $0 |
| 2013 | -- | $28,000 | $0 | $0 |
Source: Public Records
Map
Nearby Homes
- 5501 Egner St NE
- 16303 Ritchie Ave NE
- 15333 Cedar Springs Ave NE
- 6767 Wildwood Ct
- 520 Hawk Wood Ct
- 521 Snow Pine Ct NE
- 531 Snow Pine Ct NE
- 561 Snow Pine Ct NE
- 551 Snow Pine Ct
- 11288 18 Mile Rd NE
- 11260 18 Mile Rd NE
- 500 Needlewood Dr NE
- 376 Needlewood Dr NE
- 510 Needlewood Dr
- 6790 19 Mile Rd NE
- 551 Hawk Wood Ct
- Integrity 2190 Plan at White Pine Trails - Integrity
- Elements 1680 Plan at White Pine Trails
- Integrity 1880 Plan at White Pine Trails - Integrity
- Integrity 1520 Plan at White Pine Trails - Integrity
- 5362 Egner St NE
- 5368 Egner St
- 15988 Northland Dr
- 5270 Egner St NE
- 5261 Egner St
- 5270 Egner St
- 5416 Egner St
- 16078 Northland Dr
- 16078 Northland Dr NE
- 5415 Egner St NE
- 5202 Egner St
- 5415 Egner St
- 16000 Northland Dr
- 5440 Egner St
- 5233 Egner St
- 5480 Egner St
- 5475 Egner St
- 16115 Morel Ln
- 5150 Egner St
- 5163 Egner St