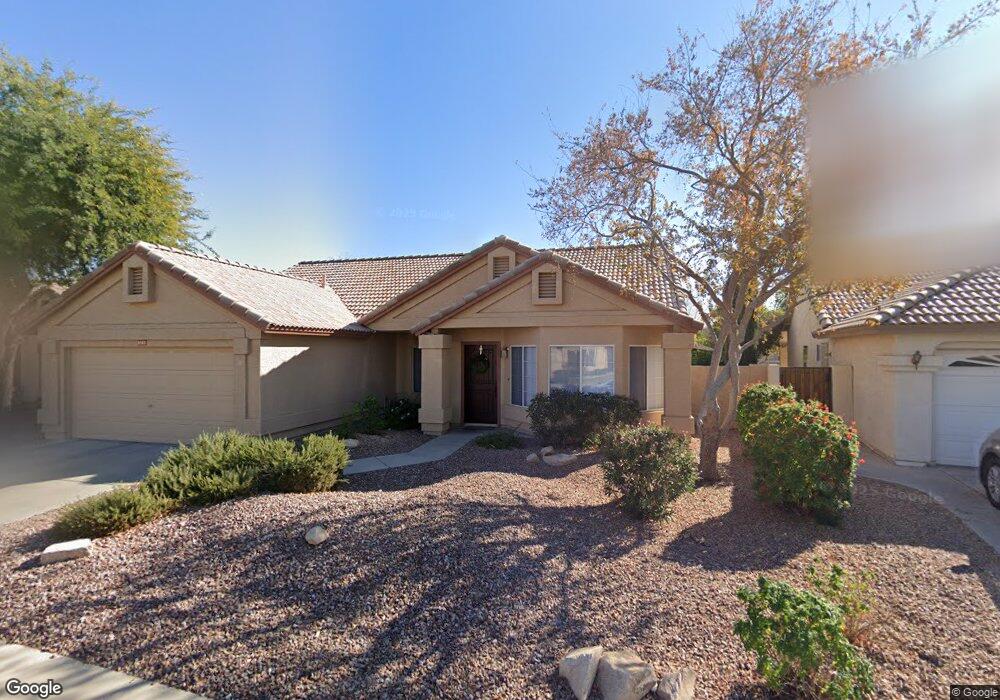
5363 W Elgin St Chandler, AZ 85226
West Chandler NeighborhoodEstimated Value: $474,982 - $546,000
3
Beds
2
Baths
1,729
Sq Ft
$301/Sq Ft
Est. Value
About This Home
This home is located at 5363 W Elgin St, Chandler, AZ 85226 and is currently estimated at $520,246, approximately $300 per square foot. 5363 W Elgin St is a home located in Maricopa County with nearby schools including Kyrene de la Paloma School, Kyrene del Pueblo Middle School, and Corona Del Sol High School.
Ownership History
Date
Name
Owned For
Owner Type
Purchase Details
Closed on
Feb 9, 2010
Sold by
Hillman James and Reiter Pemma D
Bought by
Hillman James and Reiter Pemma D
Current Estimated Value
Home Financials for this Owner
Home Financials are based on the most recent Mortgage that was taken out on this home.
Original Mortgage
$160,783
Interest Rate
4.93%
Mortgage Type
New Conventional
Purchase Details
Closed on
Sep 15, 2003
Sold by
Pope Steven R and Pope Jennifer M
Bought by
Hillman James
Home Financials for this Owner
Home Financials are based on the most recent Mortgage that was taken out on this home.
Original Mortgage
$160,800
Interest Rate
4.75%
Mortgage Type
Purchase Money Mortgage
Purchase Details
Closed on
Jun 6, 1995
Sold by
Ryland Homes Of Arizona Inc
Bought by
Pope Steven R and Pope Jennifer M
Home Financials for this Owner
Home Financials are based on the most recent Mortgage that was taken out on this home.
Original Mortgage
$117,200
Interest Rate
7.92%
Mortgage Type
New Conventional
Create a Home Valuation Report for This Property
The Home Valuation Report is an in-depth analysis detailing your home's value as well as a comparison with similar homes in the area
Home Values in the Area
Average Home Value in this Area
Purchase History
| Date | Buyer | Sale Price | Title Company |
|---|---|---|---|
| Hillman James | -- | Nations Title Agency Inc | |
| Hillman James | $201,000 | Capital Title Agency Inc | |
| Pope Steven R | $123,000 | United Title Agency | |
| Ryland Homes Of Arizona Inc | $104,082 | United Title Agency |
Source: Public Records
Mortgage History
| Date | Status | Borrower | Loan Amount |
|---|---|---|---|
| Closed | Hillman James | $160,783 | |
| Closed | Hillman James | $160,800 | |
| Previous Owner | Pope Steven R | $117,200 |
Source: Public Records
Tax History Compared to Growth
Tax History
| Year | Tax Paid | Tax Assessment Tax Assessment Total Assessment is a certain percentage of the fair market value that is determined by local assessors to be the total taxable value of land and additions on the property. | Land | Improvement |
|---|---|---|---|---|
| 2025 | $2,137 | $26,828 | -- | -- |
| 2024 | $2,044 | $25,551 | -- | -- |
| 2023 | $2,044 | $40,160 | $8,030 | $32,130 |
| 2022 | $1,945 | $31,010 | $6,200 | $24,810 |
| 2021 | $2,052 | $29,550 | $5,910 | $23,640 |
| 2020 | $2,005 | $27,610 | $5,520 | $22,090 |
| 2019 | $1,946 | $27,000 | $5,400 | $21,600 |
| 2018 | $1,882 | $25,450 | $5,090 | $20,360 |
| 2017 | $1,794 | $24,570 | $4,910 | $19,660 |
| 2016 | $1,831 | $23,510 | $4,700 | $18,810 |
| 2015 | $1,690 | $22,310 | $4,460 | $17,850 |
Source: Public Records
Map
Nearby Homes
- 5361 W Saragosa St
- 5330 W Kesler Ln
- 840 S Pineview Dr
- 5580 W Kesler St
- 5043 W Whitten St
- 5137 W Jupiter Way
- 5041 W Kesler Ln
- 5143 W Mercury Way
- 5455 W Buffalo St
- 255 S Kyrene Rd Unit 231
- 255 S Kyrene Rd Unit 111
- 4790 W Geronimo St
- 5151 W Glenview Place
- 5882 W Mercury Way
- 4624 W Chicago St
- 4613 W Chicago St Unit 2
- 4650 W Geronimo St
- 4612 W Jupiter Way
- 4628 W Buffalo St
- 300 N Gila Springs Blvd Unit 181
- 5373 W Elgin St
- 5353 W Elgin St
- 5343 W Elgin St
- 482 S Forest Dr
- 5383 W Elgin St
- 502 S Forest Dr
- 5350 W Whitten St
- 5360 W Whitten St
- 522 S Forest Dr
- 5370 W Whitten St
- 5340 W Whitten St
- 5372 W Elgin St
- 5333 W Elgin St
- 5393 W Elgin St
- 5362 W Elgin St
- 5382 W Elgin St
- 5330 W Whitten St
- 5380 W Whitten St
- 5352 W Elgin St
- 5392 W Elgin St