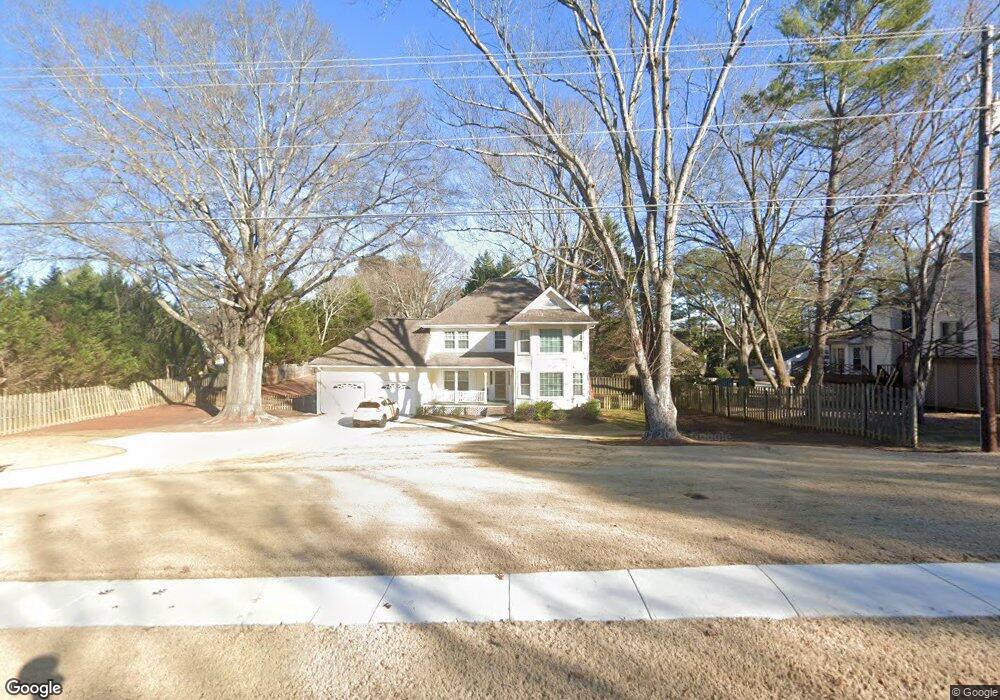
5364 W Jones Bridge Rd Unit 2 Norcross, GA 30092
Estimated Value: $552,000 - $566,990
4
Beds
3
Baths
2,078
Sq Ft
$269/Sq Ft
Est. Value
About This Home
This home is located at 5364 W Jones Bridge Rd Unit 2, Norcross, GA 30092 and is currently estimated at $557,998, approximately $268 per square foot. 5364 W Jones Bridge Rd Unit 2 is a home located in Gwinnett County with nearby schools including Simpson Elementary School, Pinckneyville Middle School, and Norcross High School.
Ownership History
Date
Name
Owned For
Owner Type
Purchase Details
Closed on
Nov 15, 2024
Sold by
Carver George
Bought by
Carver George Charles Trust and Carver George Charles
Current Estimated Value
Purchase Details
Closed on
May 30, 2020
Sold by
Carver Judy Lynn
Bought by
Carver George C
Home Financials for this Owner
Home Financials are based on the most recent Mortgage that was taken out on this home.
Original Mortgage
$288,970
Interest Rate
3.2%
Mortgage Type
FHA
Purchase Details
Closed on
Nov 19, 1999
Sold by
Carver George C
Bought by
Carver George C and Carver Judy L
Home Financials for this Owner
Home Financials are based on the most recent Mortgage that was taken out on this home.
Original Mortgage
$152,000
Interest Rate
7.89%
Mortgage Type
New Conventional
Purchase Details
Closed on
May 15, 1995
Sold by
Lee Brian J and Knapp Lynna J
Bought by
Gibb Cecil H Carole E
Create a Home Valuation Report for This Property
The Home Valuation Report is an in-depth analysis detailing your home's value as well as a comparison with similar homes in the area
Home Values in the Area
Average Home Value in this Area
Purchase History
| Date | Buyer | Sale Price | Title Company |
|---|---|---|---|
| Carver George Charles Trust | -- | -- | |
| Carver George C | -- | -- | |
| Carver George C | -- | -- | |
| Carver George C | $190,000 | -- | |
| Gibb Cecil H Carole E | $163,000 | -- |
Source: Public Records
Mortgage History
| Date | Status | Borrower | Loan Amount |
|---|---|---|---|
| Previous Owner | Carver George C | $288,970 | |
| Previous Owner | Carver George C | $152,000 | |
| Closed | Gibb Cecil H Carole E | $0 |
Source: Public Records
Tax History Compared to Growth
Tax History
| Year | Tax Paid | Tax Assessment Tax Assessment Total Assessment is a certain percentage of the fair market value that is determined by local assessors to be the total taxable value of land and additions on the property. | Land | Improvement |
|---|---|---|---|---|
| 2025 | $4,937 | $174,040 | $38,000 | $136,040 |
| 2024 | $5,188 | $179,600 | $50,400 | $129,200 |
| 2023 | $5,188 | $151,600 | $44,000 | $107,600 |
| 2022 | $4,296 | $136,160 | $36,000 | $100,160 |
| 2021 | $3,902 | $113,600 | $35,520 | $78,080 |
| 2020 | $3,925 | $113,600 | $35,520 | $78,080 |
| 2019 | $3,699 | $109,120 | $30,000 | $79,120 |
| 2018 | $3,710 | $109,120 | $30,000 | $79,120 |
| 2016 | $3,249 | $93,080 | $24,000 | $69,080 |
| 2015 | $3,287 | $93,080 | $24,000 | $69,080 |
| 2014 | -- | $93,080 | $24,000 | $69,080 |
Source: Public Records
Map
Nearby Homes
- 5350 Wickershire Dr
- 5440 Clinchfield Trail
- 5221 W Jones Bridge Rd
- 5397 Valley Mist Ct
- 5354 Fox Hill Dr
- 5201 Edgerton Dr
- 5545 Fitzpatrick Terrace
- 4916 Sudbrook Way Unit 253
- The Adams Plan at Waterside - Condos
- 4457 Watervale Way Unit 292
- 4477 Watervale Way Unit 286
- 5047 Shirley Oaks Dr Unit 313
- 4903 Sudbrook Way Unit 239
- The Stanley Plan at Waterside - Single Family
- The Stafford Plan at Waterside - Single Family
- 5039 Shirley Oaks Dr Unit 315
- 4479 Watervale Way Unit 285
- 5059 Shirley Oaks Dr Unit 309
- The Barrett II Plan at Waterside - Condos
- The Benton II Plan at Waterside - Townhomes
- 5212 Amhurst Dr
- 5218 Amhurst Dr Unit 4
- 5386 Amhurst Dr Unit 3
- 5224 Amhurst Dr
- 5351 W Jones Bridge Rd
- 5380 Amhurst Dr Unit 3
- 5230 Amhurst Dr
- 5213 Amhurst Dr
- 5207 Amhurst Dr
- 5219 Amhurst Dr
- 4301 Doerun Ct
- 5395 Amhurst Dr
- 5374 Amhurst Dr
- 5225 Amhurst Dr
- 5387 Amhurst Dr
- 5341 W Jones Bridge Rd
- 5361 W Jones Bridge Rd Unit 1
- 4311 Doerun Ct
- 5236 Amhurst Dr
- 5231 Amhurst Dr