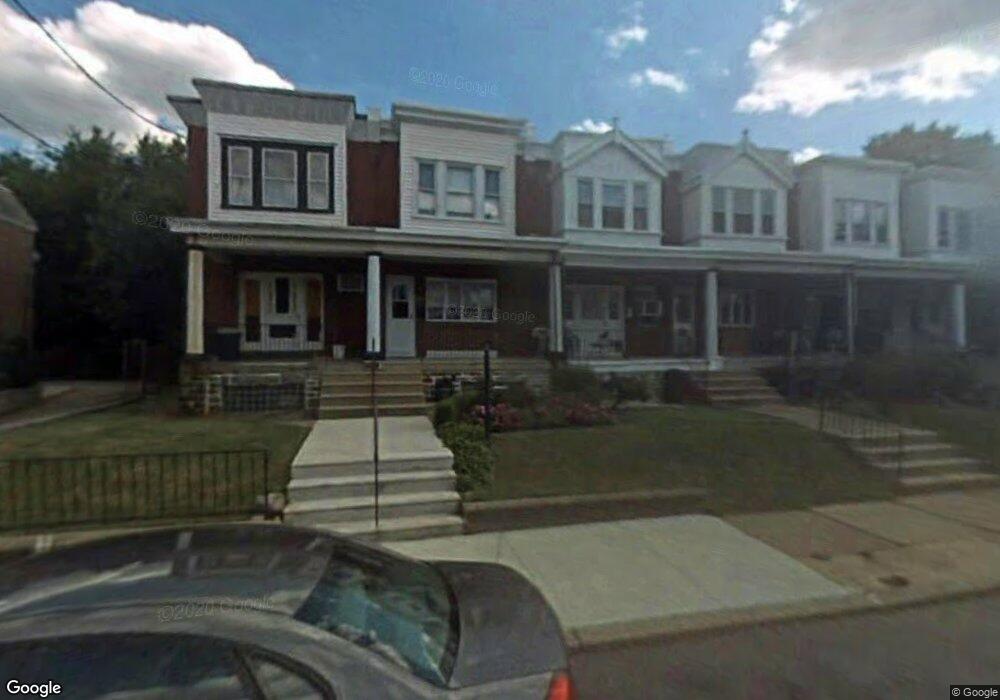
5367 Charles St Philadelphia, PA 19124
Frankford NeighborhoodEstimated Value: $103,000 - $200,000
3
Beds
1
Bath
1,104
Sq Ft
$157/Sq Ft
Est. Value
About This Home
This home is located at 5367 Charles St, Philadelphia, PA 19124 and is currently estimated at $172,911, approximately $156 per square foot. 5367 Charles St is a home located in Philadelphia County with nearby schools including James J. Sullivan School, Harding Warren G Middle School, and Frankford High School.
Ownership History
Date
Name
Owned For
Owner Type
Purchase Details
Closed on
Oct 1, 2024
Sold by
Siyam Fadi Izzat
Bought by
Alzubi Mamdooh and Sammour Ruah
Current Estimated Value
Home Financials for this Owner
Home Financials are based on the most recent Mortgage that was taken out on this home.
Original Mortgage
$74,000
Outstanding Balance
$73,222
Interest Rate
6.35%
Mortgage Type
New Conventional
Estimated Equity
$99,689
Purchase Details
Closed on
Jul 31, 2024
Sold by
Siyam Izzat A and Seyam Zaina
Bought by
Siyam Fadi Izzat
Purchase Details
Closed on
Feb 22, 2020
Sold by
Siyam Izzat
Bought by
Siyam Izzat and Seyam Zaina
Purchase Details
Closed on
Sep 30, 2019
Sold by
Siyam Farag A
Bought by
Siyam Izzat
Purchase Details
Closed on
Feb 2, 2002
Sold by
Bisoso Ramon
Bought by
Siyam Farag A
Purchase Details
Closed on
Oct 6, 1998
Sold by
Siyam Farag A
Bought by
Bisoso Ramon
Create a Home Valuation Report for This Property
The Home Valuation Report is an in-depth analysis detailing your home's value as well as a comparison with similar homes in the area
Home Values in the Area
Average Home Value in this Area
Purchase History
| Date | Buyer | Sale Price | Title Company |
|---|---|---|---|
| Alzubi Mamdooh | $92,500 | None Listed On Document | |
| Siyam Fadi Izzat | -- | Partners Abstract Of Pa | |
| Siyam Izzat | -- | None Available | |
| Siyam Izzat | -- | None Available | |
| Siyam Farag A | $34,918 | None Available | |
| Bisoso Ramon | $59,000 | -- |
Source: Public Records
Mortgage History
| Date | Status | Borrower | Loan Amount |
|---|---|---|---|
| Open | Alzubi Mamdooh | $74,000 |
Source: Public Records
Tax History Compared to Growth
Tax History
| Year | Tax Paid | Tax Assessment Tax Assessment Total Assessment is a certain percentage of the fair market value that is determined by local assessors to be the total taxable value of land and additions on the property. | Land | Improvement |
|---|---|---|---|---|
| 2025 | $1,779 | $171,200 | $34,240 | $136,960 |
| 2024 | $1,779 | $171,200 | $34,240 | $136,960 |
| 2023 | $1,779 | $127,100 | $25,400 | $101,700 |
| 2022 | $1,550 | $127,100 | $25,400 | $101,700 |
| 2021 | $1,550 | $0 | $0 | $0 |
| 2020 | $1,550 | $0 | $0 | $0 |
| 2019 | $1,487 | $0 | $0 | $0 |
| 2018 | $1,120 | $0 | $0 | $0 |
| 2017 | $1,120 | $0 | $0 | $0 |
| 2016 | $1,120 | $0 | $0 | $0 |
| 2015 | -- | $0 | $0 | $0 |
| 2014 | -- | $80,000 | $35,108 | $44,892 |
| 2012 | -- | $9,920 | $1,002 | $8,918 |
Source: Public Records
Map
Nearby Homes
- 5334 Charles St
- 1708 Kennedy St
- 4669 Mulberry St
- 5387 1/2 Charles St
- 5400 Tackawanna St
- 5408 Charles St
- 5236 Marlowe St
- 5400 Valley St
- 5320 Duffield St
- 5201 Hawthorne St
- 5337 Hedge St
- 1665 Bridge St
- 1663 Bridge St
- 5132 Walker St
- 5452 Hawthorne St
- 5442 Valley St
- 5454 Tackawanna St
- 5106 Walker St
- 5315 Lesher St
- 5026 Charles St
- 5365 Charles St
- 5363 Charles St
- 5369 Charles St
- 5361 Charles St
- 5371 Charles St
- 5359 Charles St
- 5357 Charles St
- 5355 Charles St
- 5373 1/2 Charles St
- 5373 Charles St
- 5353 Charles St
- 5375 Charles St
- 5351 Charles St
- 5375 1/2 Charles St
- 5377 Charles St
- 5349 Charles St
- 5347 Charles St
- 5377 1/2 Charles St
- 5350 Charles St
- 5348 Charles St