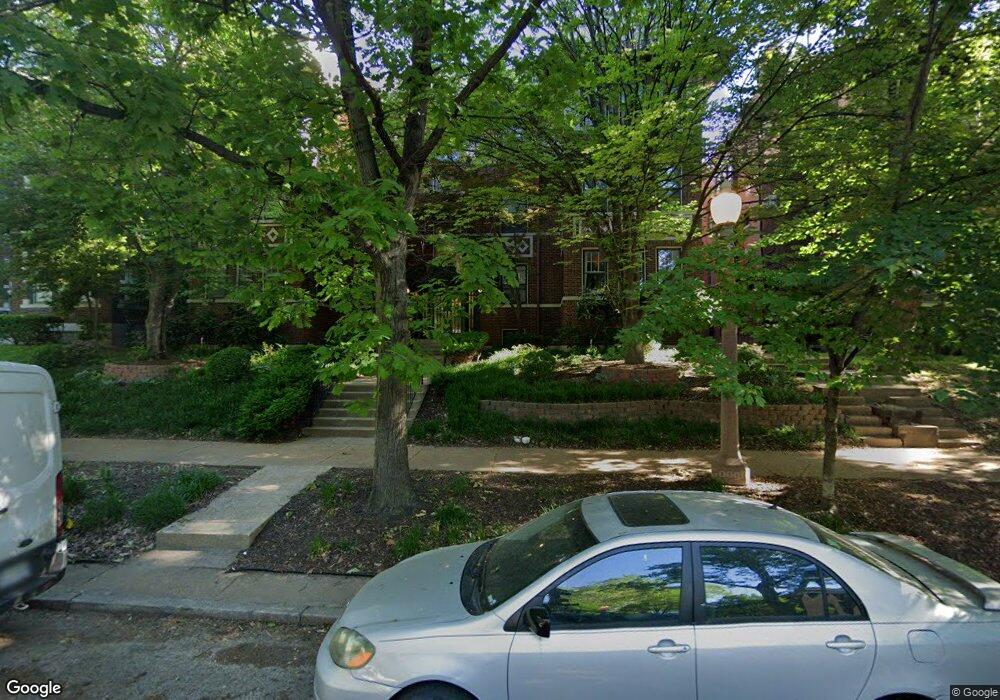
5367 Pershing Ave Saint Louis, MO 63112
Central West End NeighborhoodEstimated Value: $147,000 - $172,000
Studio
1
Bath
982
Sq Ft
$165/Sq Ft
Est. Value
About This Home
This home is located at 5367 Pershing Ave, Saint Louis, MO 63112 and is currently estimated at $162,451, approximately $165 per square foot. 5367 Pershing Ave is a home located in St. Louis City with nearby schools including Sumner High School, KIPP Victory Academy, and KIPP Triumph Academy.
Ownership History
Date
Name
Owned For
Owner Type
Purchase Details
Closed on
May 15, 2023
Sold by
Dickey Jonathan
Bought by
Payne Emma
Current Estimated Value
Purchase Details
Closed on
Apr 30, 2019
Sold by
Foley Penny A and Foley Robert J
Bought by
Dickey Jonathan and Dickey Sarah
Home Financials for this Owner
Home Financials are based on the most recent Mortgage that was taken out on this home.
Original Mortgage
$118,500
Interest Rate
4%
Mortgage Type
New Conventional
Purchase Details
Closed on
May 21, 2005
Sold by
Holmer C Anders C and Holmer Laurel D
Bought by
Foley Robert J and Foley Penny A
Home Financials for this Owner
Home Financials are based on the most recent Mortgage that was taken out on this home.
Original Mortgage
$141,200
Interest Rate
5.83%
Mortgage Type
Fannie Mae Freddie Mac
Create a Home Valuation Report for This Property
The Home Valuation Report is an in-depth analysis detailing your home's value as well as a comparison with similar homes in the area
Home Values in the Area
Average Home Value in this Area
Purchase History
| Date | Buyer | Sale Price | Title Company |
|---|---|---|---|
| Payne Emma | -- | None Listed On Document | |
| Dickey Jonathan | $158,000 | Chesterfield Title Agcy Llc | |
| Foley Robert J | -- | Abstar Title Company | |
| Holmer C Anders C | -- | Abstar Title Company |
Source: Public Records
Mortgage History
| Date | Status | Borrower | Loan Amount |
|---|---|---|---|
| Previous Owner | Dickey Jonathan | $118,500 | |
| Previous Owner | Foley Robert J | $141,200 |
Source: Public Records
Tax History
| Year | Tax Paid | Tax Assessment Tax Assessment Total Assessment is a certain percentage of the fair market value that is determined by local assessors to be the total taxable value of land and additions on the property. | Land | Improvement |
|---|---|---|---|---|
| 2025 | $2,475 | $28,750 | -- | $28,750 |
| 2024 | $2,365 | $26,870 | -- | $26,870 |
| 2023 | $2,365 | $26,870 | $0 | $26,870 |
| 2022 | $2,354 | $25,840 | $0 | $25,840 |
| 2021 | $2,353 | $25,840 | $0 | $25,840 |
| 2020 | $2,336 | $25,840 | $0 | $25,840 |
| 2019 | $2,329 | $25,840 | $0 | $25,840 |
| 2018 | $2,395 | $25,840 | $0 | $25,840 |
| 2017 | $2,358 | $25,840 | $0 | $25,840 |
| 2016 | $2,386 | $25,840 | $0 | $25,840 |
| 2015 | $2,181 | $25,840 | $0 | $25,840 |
| 2014 | $1,960 | $25,840 | $0 | $25,840 |
| 2013 | -- | $25,840 | $0 | $25,840 |
Source: Public Records
Map
Nearby Homes
- 5381 Pershing Ave Unit 104
- 88 Waterman Place
- 5330 Pershing Ave Unit 106
- 5330 Pershing Ave Unit 506
- 5316 Pershing Ave Unit 406
- 5510 Waterman Blvd Unit 602
- 5544 Waterman Blvd Unit 3W
- 5539 Waterman Blvd Unit 2N
- 5559 Pershing Ave Unit 1
- 5591 Waterman Blvd Unit A
- 5354 Delmar Ct
- 5621 Waterman Blvd Unit 5
- 5362 Delmar Ct
- 5402 Delmar Ct
- 5404 Delmar Ct
- 5346 Delmar Blvd
- 5164 Waterman Blvd
- 5661 Waterman Blvd Unit 1N
- 5683 Waterman Blvd Unit 2W
- 5696 Kingsbury Ave Unit 107
- 5367 Pershing Ave Unit 8
- 5367 Pershing Ave
- 5367 Pershing Ave
- 5367 Pershing Ave
- 5367 Pershing Ave
- 5367 Pershing Ave
- 5367 Pershing Ave
- 5367 Pershing Ave
- 5367 Pershing Ave
- 5367 Pershing Ave Unit 3
- 5367 Pershing Ave Unit 2
- 5367 Pershing Ave Unit 1
- 5367 Pershing Ave Unit 9
- 5361 Pershing Ave
- 5351 Pershing Ave
- 5375 Pershing Ave
- 5375 Pershing Ave
- 5375 Pershing Ave
- 5375 Pershing Ave
- 5375 Pershing Ave