Estimated Value: $205,000 - $257,000
3
Beds
3
Baths
1,396
Sq Ft
$169/Sq Ft
Est. Value
About This Home
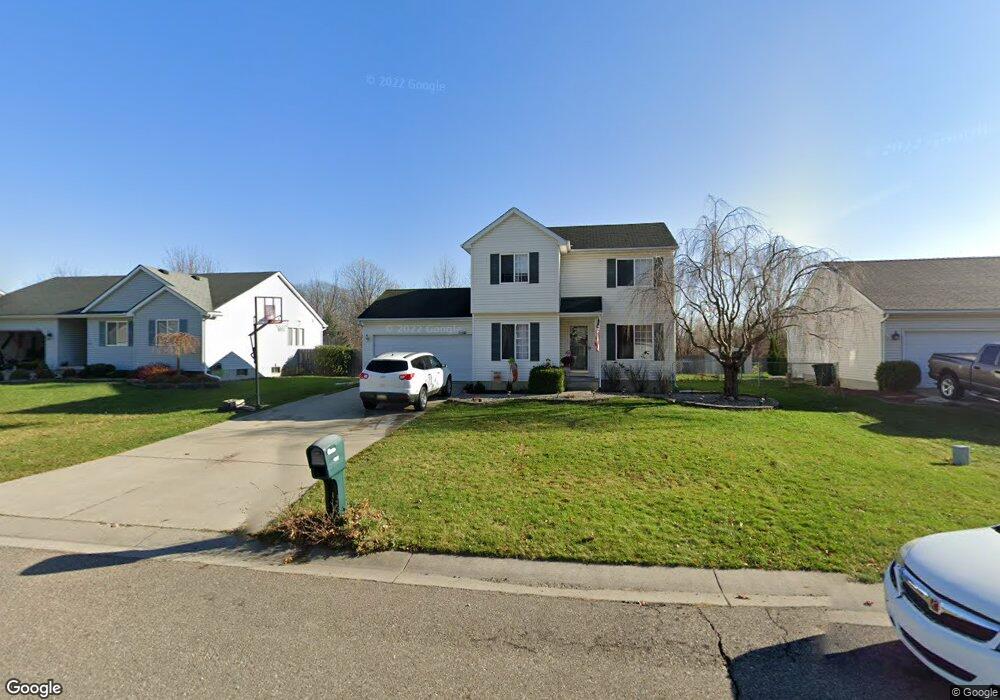
This home is located at 5369 Tall Oaks Dr Unit 11, Flint, MI 48507 and is currently estimated at $236,481, approximately $169 per square foot. 5369 Tall Oaks Dr Unit 11 is a home located in Genesee County with nearby schools including Anderson Elementary School, McGrath Elementary School, and Grand Blanc West Middle School.
Ownership History
Date
Name
Owned For
Owner Type
Purchase Details
Closed on
Jul 27, 2022
Sold by
Boeneman Shawn A
Bought by
Boeneman Shawn A and Boeneman Tuesday A
Current Estimated Value
Home Financials for this Owner
Home Financials are based on the most recent Mortgage that was taken out on this home.
Original Mortgage
$150,000
Outstanding Balance
$143,433
Interest Rate
5.7%
Mortgage Type
New Conventional
Estimated Equity
$93,048
Purchase Details
Closed on
May 15, 2007
Sold by
Wendell Rex Allen and Wendell Heidi
Bought by
Boenemen Shawn A
Home Financials for this Owner
Home Financials are based on the most recent Mortgage that was taken out on this home.
Original Mortgage
$27,000
Interest Rate
6.22%
Mortgage Type
Credit Line Revolving
Purchase Details
Closed on
Sep 30, 2002
Sold by
Mapes Anne K and Prater Pearla A
Bought by
Wendell Rex Allen and Wendell Heidi
Purchase Details
Closed on
Mar 24, 2000
Sold by
Olmack Builders Inc
Bought by
Mapes Anne K and Prater Pearla A
Home Financials for this Owner
Home Financials are based on the most recent Mortgage that was taken out on this home.
Original Mortgage
$106,150
Interest Rate
8.25%
Mortgage Type
Purchase Money Mortgage
Create a Home Valuation Report for This Property
The Home Valuation Report is an in-depth analysis detailing your home's value as well as a comparison with similar homes in the area
Home Values in the Area
Average Home Value in this Area
Purchase History
| Date | Buyer | Sale Price | Title Company |
|---|---|---|---|
| Boeneman Shawn A | -- | None Listed On Document | |
| Boenemen Shawn A | $135,000 | Sargents Title Company | |
| Wendell Rex Allen | $141,000 | Sargents Title Company | |
| Mapes Anne K | $124,900 | Greco Title | |
| Olmack Builders Inc | $25,000 | Philip F Greco Title Company |
Source: Public Records
Mortgage History
| Date | Status | Borrower | Loan Amount |
|---|---|---|---|
| Open | Boeneman Shawn A | $150,000 | |
| Previous Owner | Boenemen Shawn A | $27,000 | |
| Previous Owner | Mapes Anne K | $106,150 |
Source: Public Records
Tax History Compared to Growth
Tax History
| Year | Tax Paid | Tax Assessment Tax Assessment Total Assessment is a certain percentage of the fair market value that is determined by local assessors to be the total taxable value of land and additions on the property. | Land | Improvement |
|---|---|---|---|---|
| 2025 | $2,711 | $96,900 | $0 | $0 |
| 2024 | $1,543 | $89,500 | $0 | $0 |
| 2023 | $1,472 | $78,400 | $0 | $0 |
| 2022 | $2,414 | $79,400 | $0 | $0 |
| 2021 | $2,357 | $76,100 | $0 | $0 |
| 2020 | $1,358 | $68,600 | $0 | $0 |
| 2019 | $1,338 | $64,800 | $0 | $0 |
| 2018 | $2,171 | $61,700 | $0 | $0 |
| 2017 | $2,062 | $62,100 | $0 | $0 |
| 2016 | $2,045 | $56,000 | $0 | $0 |
| 2015 | $1,947 | $55,500 | $0 | $0 |
| 2012 | -- | $51,200 | $51,200 | $0 |
Source: Public Records
Map
Nearby Homes
- 1226 Harding Dr
- 0 Harding Dr Unit 20251056693
- 1329 Rollins St
- 1096 Harding Dr
- 00 Mckinley Blvd
- 000 Mckinley Blvd
- 5400 Ali Dr
- 0000 Mckinley Blvd
- 0000 Coolidge Dr
- 1075 E Hill Rd
- 00 Coolidge Dr
- 000 Coolidge Dr
- 1037 E Hill Rd
- 5152 Sandalwood Cir
- 1045 Leisure Dr Unit 7
- 5148 Sandalwood Cir
- 5146 Sandalwood Cir
- 6137 Pebbleshire Dr
- 5160 Sandalwood Dr
- 5368 Boland Dr
- 5363 Tall Oaks Dr Unit 10
- 5373 Tall Oaks Dr Unit Bldg-Unit
- 5373 Tall Oaks Dr Unit 12
- 5379 Tall Oaks Dr
- 5357 Tall Oaks Dr Unit 9
- 5368 Tall Oaks Dr Unit 31
- 5364 Tall Oaks Dr Unit 32
- 5372 Tall Oaks Dr Unit 30
- 5351 Tall Oaks Drive #8
- 5383 Tall Oaks Dr
- 5351 Tall Oaks Dr Unit 8
- 5360 Tall Oaks Dr Unit 33
- 5376 Tall Oaks Dr
- 5356 Tall Oaks Dr Unit 34
- 5380 Tall Oaks Dr Unit 28
- 5345 Tall Oaks Dr
- 1224 Lincoln Dr
- 5393 Tall Oaks Dr Unit 16
- 5339 Tall Oaks Dr Unit 6
- 5348 Tall Oaks Dr Unit 1