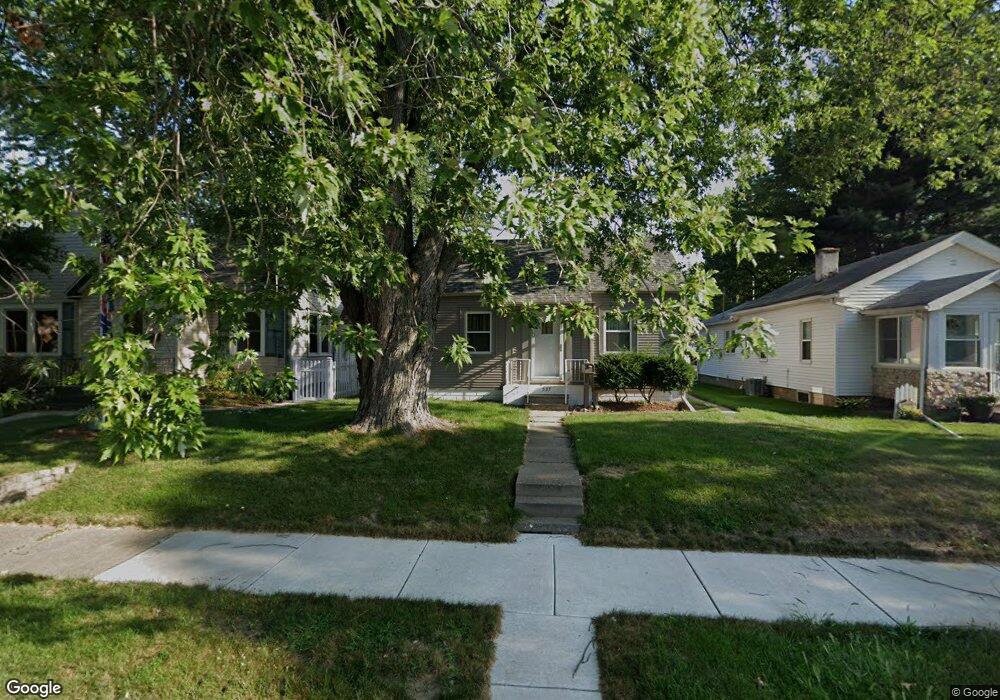
537 27th Ave Moline, IL 61265
Karstens-City Line NeighborhoodEstimated Value: $111,098 - $135,000
2
Beds
--
Bath
605
Sq Ft
$205/Sq Ft
Est. Value
About This Home
This home is located at 537 27th Ave, Moline, IL 61265 and is currently estimated at $124,275, approximately $205 per square foot. 537 27th Ave is a home located in Rock Island County with nearby schools including Hamilton Elementary School, John Deere Middle School, and Moline Sr High School.
Ownership History
Date
Name
Owned For
Owner Type
Purchase Details
Closed on
Oct 25, 2022
Sold by
Daniel Theresa E
Bought by
Stiner William T
Current Estimated Value
Home Financials for this Owner
Home Financials are based on the most recent Mortgage that was taken out on this home.
Original Mortgage
$92,650
Outstanding Balance
$87,862
Interest Rate
4.38%
Mortgage Type
New Conventional
Estimated Equity
$36,413
Purchase Details
Closed on
Jun 30, 2017
Sold by
Daniel Theresa E
Bought by
Daniel Theresa E
Home Financials for this Owner
Home Financials are based on the most recent Mortgage that was taken out on this home.
Original Mortgage
$44,000
Interest Rate
3.88%
Mortgage Type
New Conventional
Purchase Details
Closed on
Jun 23, 2017
Sold by
Padesky Joseph and Padesky Melissa
Bought by
Daniel Theresa E
Home Financials for this Owner
Home Financials are based on the most recent Mortgage that was taken out on this home.
Original Mortgage
$44,000
Interest Rate
3.88%
Mortgage Type
New Conventional
Create a Home Valuation Report for This Property
The Home Valuation Report is an in-depth analysis detailing your home's value as well as a comparison with similar homes in the area
Home Values in the Area
Average Home Value in this Area
Purchase History
| Date | Buyer | Sale Price | Title Company |
|---|---|---|---|
| Stiner William T | $109,000 | Gomez Title | |
| Daniel Theresa E | -- | -- | |
| Daniel Theresa E | $55,000 | Mason & Scott Pc | |
| Daniel Theresa E | $55,000 | -- |
Source: Public Records
Mortgage History
| Date | Status | Borrower | Loan Amount |
|---|---|---|---|
| Open | Stiner William T | $92,650 | |
| Previous Owner | Daniel Theresa E | $44,000 | |
| Previous Owner | Daniel Theresa E | $44,000 |
Source: Public Records
Tax History
| Year | Tax Paid | Tax Assessment Tax Assessment Total Assessment is a certain percentage of the fair market value that is determined by local assessors to be the total taxable value of land and additions on the property. | Land | Improvement |
|---|---|---|---|---|
| 2024 | $2,251 | $31,509 | $4,773 | $26,736 |
| 2023 | $2,251 | $30,123 | $4,563 | $25,560 |
| 2022 | $1,645 | $24,075 | $4,563 | $19,512 |
| 2021 | $1,613 | $22,994 | $4,358 | $18,636 |
| 2020 | $162 | $22,857 | $4,332 | $18,525 |
| 2019 | $1,577 | $22,321 | $4,230 | $18,091 |
| 2018 | $1,466 | $21,353 | $4,180 | $17,173 |
| 2017 | $1,994 | $20,914 | $4,094 | $16,820 |
| 2016 | $1,971 | $20,565 | $4,026 | $16,539 |
| 2015 | $1,929 | $20,142 | $3,943 | $16,199 |
| 2014 | $464 | $20,099 | $3,935 | $16,164 |
| 2013 | $464 | $20,099 | $3,935 | $16,164 |
Source: Public Records
Map
Nearby Homes
- 400 29th Avenue Dr Unit 7C
- 2327 6th St
- 2334 5th St
- 574-632 3rd St
- 301 30th Avenue Ct
- 310 30th Avenue Ct Unit 7
- 2413 3rd St
- 2997 3rd St Unit 200
- 630 32nd Ave
- 2110 2nd St
- 2416 12th St
- 848 20th Ave
- 2311 12th St
- 4532 23rd Ave
- 527 19th Ave
- 2330 45th St
- 12 Thornwood Ct Unit 6
- 1322 27th Ave
- 2036 46th St
- 1726 9th
Your Personal Tour Guide
Ask me questions while you tour the home.