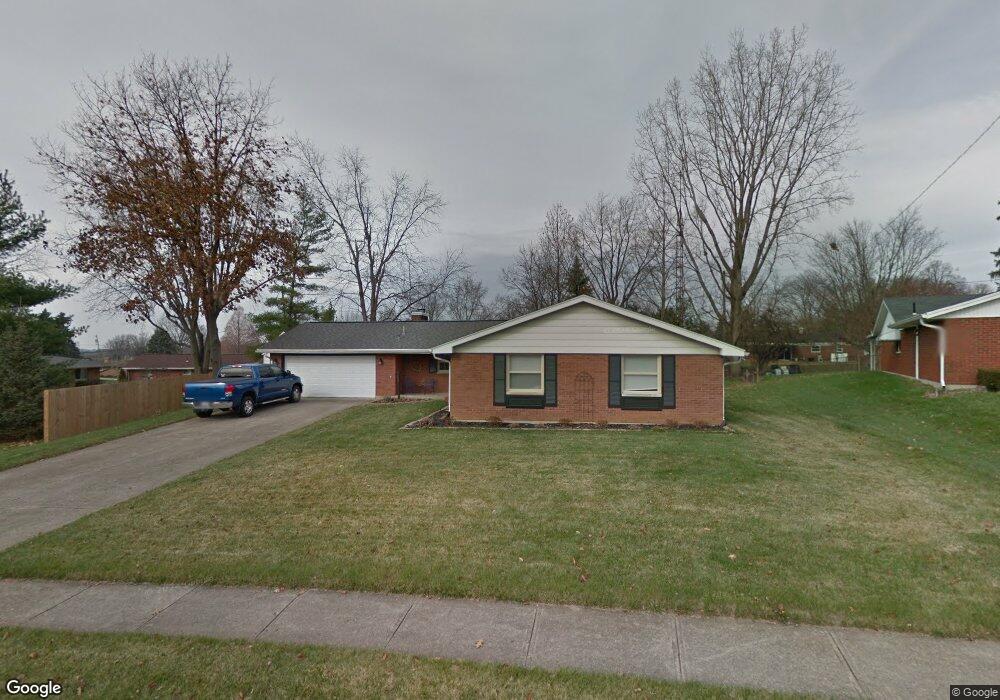
537 Adrian Ct Fairborn, OH 45324
Estimated Value: $275,000 - $286,176
4
Beds
2
Baths
1,857
Sq Ft
$152/Sq Ft
Est. Value
About This Home
This home is located at 537 Adrian Ct, Fairborn, OH 45324 and is currently estimated at $282,044, approximately $151 per square foot. 537 Adrian Ct is a home located in Greene County with nearby schools including Fairborn Primary School, Fairborn Intermediate School, and Fairborn Middle School.
Ownership History
Date
Name
Owned For
Owner Type
Purchase Details
Closed on
Jan 18, 2019
Sold by
Snavely Deborah and Nixon Terri
Bought by
Nixon Terri B and Nixon Michael E
Current Estimated Value
Purchase Details
Closed on
Oct 25, 2018
Sold by
Estate Of Doris Bastin
Bought by
Snavely Deborah and Nixon Terri
Purchase Details
Closed on
Mar 23, 2016
Sold by
Scholz Matthew S and Scholz Amanda E
Bought by
Bastin Bobby J and Bastin Doris D
Purchase Details
Closed on
Jan 9, 2014
Sold by
Gharst Joyce A and Edwick Frank Fredrick
Bought by
Scholz Matthew S and Scholz Amanda E
Home Financials for this Owner
Home Financials are based on the most recent Mortgage that was taken out on this home.
Original Mortgage
$98,188
Interest Rate
4.25%
Mortgage Type
FHA
Purchase Details
Closed on
Jun 14, 2002
Sold by
Edwick Frank
Bought by
Gharst Joyce A and Edwick Frank Fredrick
Purchase Details
Closed on
Aug 6, 1990
Bought by
Edwick Frank
Create a Home Valuation Report for This Property
The Home Valuation Report is an in-depth analysis detailing your home's value as well as a comparison with similar homes in the area
Home Values in the Area
Average Home Value in this Area
Purchase History
| Date | Buyer | Sale Price | Title Company |
|---|---|---|---|
| Nixon Terri B | -- | None Available | |
| Snavely Deborah | -- | None Available | |
| Bastin Bobby J | $135,000 | Hallmark Title | |
| Scholz Matthew S | $100,000 | None Available | |
| Gharst Joyce A | -- | -- | |
| Edwick Frank | $37,000 | -- |
Source: Public Records
Mortgage History
| Date | Status | Borrower | Loan Amount |
|---|---|---|---|
| Previous Owner | Scholz Matthew S | $98,188 |
Source: Public Records
Tax History
| Year | Tax Paid | Tax Assessment Tax Assessment Total Assessment is a certain percentage of the fair market value that is determined by local assessors to be the total taxable value of land and additions on the property. | Land | Improvement |
|---|---|---|---|---|
| 2025 | $3,843 | $81,550 | $13,190 | $68,360 |
| 2024 | $3,843 | $81,550 | $13,190 | $68,360 |
| 2023 | $3,814 | $81,550 | $13,190 | $68,360 |
| 2022 | $3,337 | $60,010 | $9,420 | $50,590 |
| 2021 | $3,306 | $53,040 | $9,420 | $43,620 |
| 2020 | $3,008 | $53,040 | $9,420 | $43,620 |
| 2019 | $2,555 | $44,090 | $7,700 | $36,390 |
| 2018 | $2,582 | $44,330 | $7,700 | $36,630 |
| 2017 | $2,566 | $44,330 | $7,700 | $36,630 |
| 2016 | $2,567 | $43,800 | $7,700 | $36,100 |
| 2015 | $2,448 | $43,800 | $7,700 | $36,100 |
| 2014 | $1,843 | $43,800 | $7,700 | $36,100 |
Source: Public Records
Map
Nearby Homes
- 625 Sharon Dr
- 1221 Harmony Ln
- 1215 Driftwood Dr
- 63 Waterford Blvd
- 1040 Baywood Dr
- 1197 Crystal Harbour Dr
- 139 Hower Ln
- 000 Morris Dr
- 388-390 Morris Dr Unit 388
- 1769 Fawnwood Ct
- 1798 Fawnwood Ct
- 827 Mitman Dr
- 406 Chapelgate Dr
- 1830 Wildflower Rd
- 1873 Wildflower Rd
- 313 Archer Dr
- 621 June Dr
- 261 Archer Dr
- 323 Mann Ave
- 801-803 Winston Dr
- 543 Adrian Ct
- 1197 Rona Parkway Dr
- 550 Dorado Dr
- 560 Dorado Dr
- 570 Dorado Dr
- 549 Adrian Ct
- 530 Adrian Ct
- 582 Dorado Dr
- 546 Adrian Ct
- 594 Dorado Dr
- 1196 Rona Parkway Dr
- 1204 Rona Parkway Dr
- 555 Adrian Ct
- 1188 Rona Parkway Dr
- 1210 Rona Parkway Dr
- 551 Dorado Dr
- 554 Adrian Ct
- 1225 Rona Parkway Dr
- 1180 Rona Parkway Dr
- 557 Dorado Dr
Your Personal Tour Guide
Ask me questions while you tour the home.