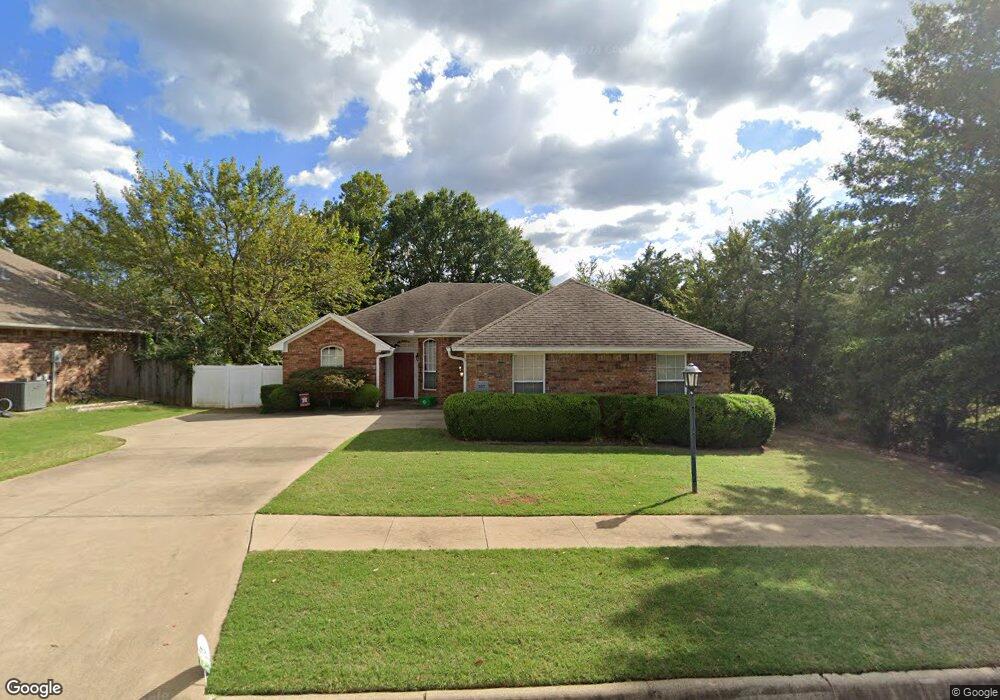
537 Crystal View van Buren, AR 72956
Estimated Value: $255,058 - $268,000
--
Bed
2
Baths
1,722
Sq Ft
$151/Sq Ft
Est. Value
About This Home
This home is located at 537 Crystal View, van Buren, AR 72956 and is currently estimated at $260,515, approximately $151 per square foot. 537 Crystal View is a home located in Crawford County with nearby schools including Rena Elementary School, Northridge Middle School, and Van Buren High School.
Ownership History
Date
Name
Owned For
Owner Type
Purchase Details
Closed on
Jun 3, 2016
Sold by
Hurst Nathan M and Wright Amber L
Bought by
Mattox Randy G and Mattox Selma
Current Estimated Value
Home Financials for this Owner
Home Financials are based on the most recent Mortgage that was taken out on this home.
Original Mortgage
$144,337
Outstanding Balance
$113,343
Interest Rate
3.25%
Mortgage Type
FHA
Estimated Equity
$147,172
Purchase Details
Closed on
Mar 17, 2005
Sold by
Rucker Fine Homes Inc
Bought by
Hurst Nathan M and Hurst Amber L
Home Financials for this Owner
Home Financials are based on the most recent Mortgage that was taken out on this home.
Original Mortgage
$106,352
Interest Rate
5.66%
Mortgage Type
New Conventional
Purchase Details
Closed on
Aug 19, 2004
Bought by
Vanburen Delv-Rucker
Create a Home Valuation Report for This Property
The Home Valuation Report is an in-depth analysis detailing your home's value as well as a comparison with similar homes in the area
Home Values in the Area
Average Home Value in this Area
Purchase History
| Date | Buyer | Sale Price | Title Company |
|---|---|---|---|
| Mattox Randy G | $147,000 | None Available | |
| Hurst Nathan M | $133,000 | -- | |
| Vanburen Delv-Rucker | $24,000 | -- |
Source: Public Records
Mortgage History
| Date | Status | Borrower | Loan Amount |
|---|---|---|---|
| Open | Mattox Randy G | $144,337 | |
| Previous Owner | Hurst Nathan M | $106,352 |
Source: Public Records
Tax History Compared to Growth
Tax History
| Year | Tax Paid | Tax Assessment Tax Assessment Total Assessment is a certain percentage of the fair market value that is determined by local assessors to be the total taxable value of land and additions on the property. | Land | Improvement |
|---|---|---|---|---|
| 2025 | $966 | $43,560 | $7,600 | $35,960 |
| 2024 | $1,066 | $43,560 | $7,600 | $35,960 |
| 2023 | $1,141 | $43,560 | $7,600 | $35,960 |
| 2022 | $1,117 | $28,740 | $4,800 | $23,940 |
| 2021 | $1,117 | $28,740 | $4,800 | $23,940 |
| 2020 | $1,117 | $28,740 | $4,800 | $23,940 |
| 2019 | $1,117 | $28,740 | $4,800 | $23,940 |
| 2018 | $1,142 | $28,740 | $4,800 | $23,940 |
| 2017 | $1,093 | $27,800 | $4,000 | $23,800 |
| 2016 | $1,093 | $27,800 | $4,000 | $23,800 |
| 2015 | $1,009 | $27,800 | $4,000 | $23,800 |
| 2014 | $1,009 | $27,800 | $4,000 | $23,800 |
Source: Public Records
Map
Nearby Homes
- 2203 Marble Cir
- 843 Richmond Rd
- 310 Copsey Dr
- 319 Copsey Dr
- 2016 Broken Hill Dr
- 305 Boulder Dr
- 2546 Old Uniontown Rd
- TBD Rena Rd
- 405 Rena Rd
- 3016 Richmond Way
- 306 Crestview Dr
- 520 Rhynes Way
- 302 Cedar Creek Dr
- 2205 Quartz Cir
- TBD Northridge Dr
- 510 Baldridge Ln
- 1610 Amble On Ln
- 415 Bronzewood Ln
- 1714 River Ridge Rd
- 1605 Amble On Ln
- 535 Crystal View
- 518 Sandstone Dr
- 531 Crystal View
- 2505 Quarry Dr
- 516 Sandstone Dr
- 602 Sandstone Dr
- 514 Sandstone Dr
- 604 Sandstone Dr
- 525 Crystal View
- 2509 Quarry Dr
- 524 Crystal View
- 512 Sandstone Dr
- 521 Crystal View
- 2511 Quarry Dr
- 518 Crystal View
- 606 Sandstone Dr
- 510 Sandstone Dr
- 2309 Quarry Dr
- 531 Mountain Edge
- 605 Sandstone Dr