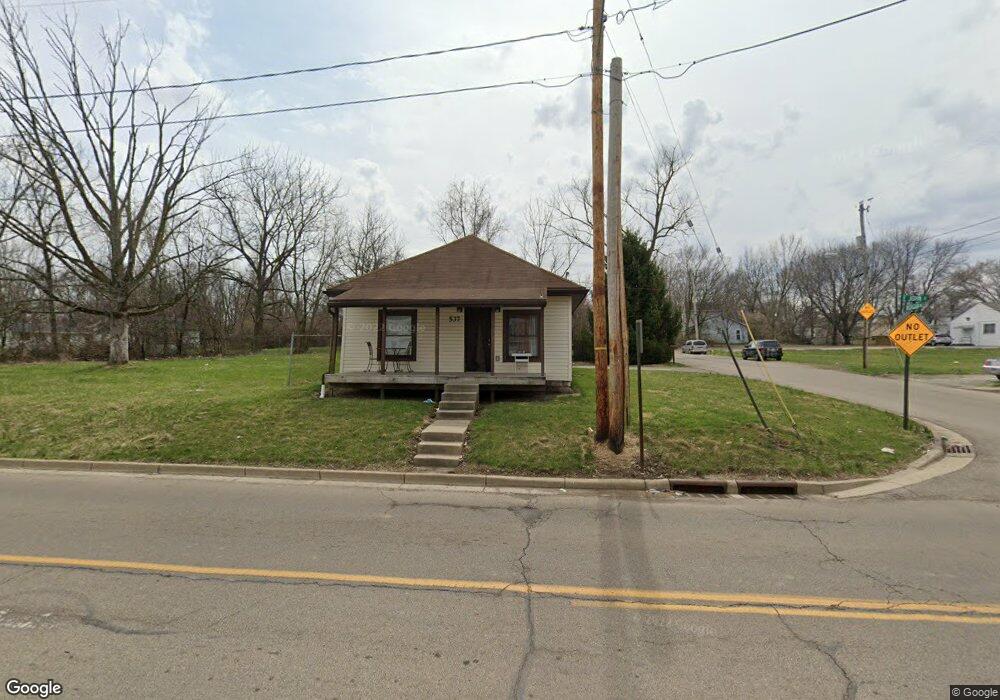
537 E John St Springfield, OH 45505
Estimated Value: $62,609 - $101,000
2
Beds
1
Bath
896
Sq Ft
$90/Sq Ft
Est. Value
About This Home
This home is located at 537 E John St, Springfield, OH 45505 and is currently estimated at $80,402, approximately $89 per square foot. 537 E John St is a home located in Clark County with nearby schools including Lincoln Elementary School, Hayward Middle School, and Springfield High School.
Ownership History
Date
Name
Owned For
Owner Type
Purchase Details
Closed on
Dec 15, 2023
Sold by
Mcpheron Group Llc
Bought by
Niclin Group Llc
Current Estimated Value
Purchase Details
Closed on
Apr 5, 2023
Sold by
Niclin Group Llc
Bought by
Mcpheron Group Llc
Purchase Details
Closed on
Jan 13, 2021
Sold by
Kravos Michael R and Kravos Catherine L
Bought by
Niclin Group Llc
Purchase Details
Closed on
Jan 7, 2021
Sold by
Kravos Jr Michael R and Kravos Catherine L
Bought by
Niclin Group Llc
Purchase Details
Closed on
Sep 29, 1995
Sold by
Jenks Jason L
Bought by
Kravos Michael R and Kravos Catherine
Create a Home Valuation Report for This Property
The Home Valuation Report is an in-depth analysis detailing your home's value as well as a comparison with similar homes in the area
Home Values in the Area
Average Home Value in this Area
Purchase History
| Date | Buyer | Sale Price | Title Company |
|---|---|---|---|
| Niclin Group Llc | $20,000 | None Listed On Document | |
| Mcpheron Group Llc | -- | -- | |
| Mcpheron Group Llc | -- | None Listed On Document | |
| Niclin Group Llc | $21,000 | Team Title & Closing Services | |
| Niclin Group Llc | $21,000 | Team Ttl & Closing Svcs Llc | |
| Kravos Michael R | $27,000 | -- |
Source: Public Records
Tax History
| Year | Tax Paid | Tax Assessment Tax Assessment Total Assessment is a certain percentage of the fair market value that is determined by local assessors to be the total taxable value of land and additions on the property. | Land | Improvement |
|---|---|---|---|---|
| 2025 | $420 | $12,010 | $1,180 | $10,830 |
| 2024 | $409 | $8,280 | $980 | $7,300 |
| 2023 | $409 | $8,280 | $980 | $7,300 |
| 2022 | $0 | $8,280 | $980 | $7,300 |
| 2021 | $389 | $7,080 | $840 | $6,240 |
| 2020 | $390 | $7,080 | $840 | $6,240 |
| 2019 | $391 | $7,080 | $840 | $6,240 |
| 2018 | $355 | $6,180 | $840 | $5,340 |
| 2017 | $355 | $6,181 | $840 | $5,341 |
| 2016 | $356 | $6,181 | $840 | $5,341 |
| 2015 | $181 | $6,181 | $840 | $5,341 |
| 2014 | $361 | $6,181 | $840 | $5,341 |
| 2013 | $357 | $6,181 | $840 | $5,341 |
Source: Public Records
Map
Nearby Homes
- 1846 Ohio Ave
- 1820 Clay St
- 1823 Clay St
- 1724 Clay St
- 1519 Tibbetts Ave
- 1502 Linden Ave
- 550 E Rose St
- 1754 S Fountain Ave
- 1417 Clifton Ave Unit 1419
- 2252 Ontario Ave
- 1301-1303 Clifton Ave
- 652 E Southern Ave
- 1440 Selma Rd
- 1247 Selma Rd
- 0 W Perrin Ave Unit 1043508
- 0 W Perrin Ave Unit 951292
- 1355 S Fountain Ave
- 1619 S Center Blvd
- 205 E Grand Ave
- 1008 Tibbetts Ave
- 539 E John St
- 1854 Michigan Ave
- 1841 Tibbetts Ave
- 1858 Michigan Ave
- 1841 Michigan Ave
- 1862 Michigan Ave
- 1865 Ohio Ave
- 1833 Tibbetts Ave
- 1866 Michigan Ave
- 1871 Ohio Ave
- 1870 Michigan Ave
- 1879 Michigan Ave
- 1825 Tibbetts Ave
- 1834 Tibbetts Ave
- 1852 Clay St
- 1850 Clay St
- 1860 Clay St
- 1881 Ohio Ave
- 1822 Kentucky Ave
- 1830 Tibbetts Ave
Your Personal Tour Guide
Ask me questions while you tour the home.