Estimated Value: $251,000 - $287,000
3
Beds
2
Baths
1,189
Sq Ft
$223/Sq Ft
Est. Value
About This Home
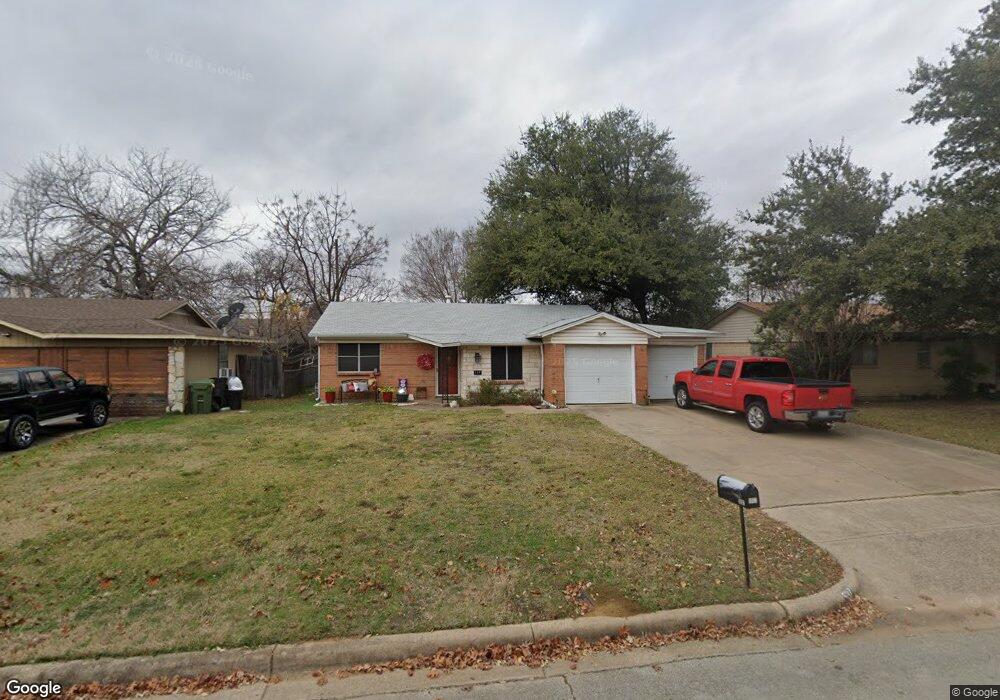
This home is located at 537 Livingston Dr, Hurst, TX 76053 and is currently estimated at $264,754, approximately $222 per square foot. 537 Livingston Dr is a home located in Tarrant County with nearby schools including Hurst Hills Elementary School, Hurst J High School, and L.D. Bell High School.
Ownership History
Date
Name
Owned For
Owner Type
Purchase Details
Closed on
Apr 22, 2005
Sold by
Rohlfs Katherine
Bought by
Maddux Fred H and Maddux Madeleine Joann
Current Estimated Value
Home Financials for this Owner
Home Financials are based on the most recent Mortgage that was taken out on this home.
Original Mortgage
$68,000
Outstanding Balance
$35,727
Interest Rate
6.06%
Mortgage Type
Fannie Mae Freddie Mac
Estimated Equity
$229,027
Purchase Details
Closed on
Sep 29, 2004
Sold by
Wright Andrea Rohlfs and Brooks Karen Rohlfs
Bought by
Rohlfs Katherine
Purchase Details
Closed on
Mar 23, 1998
Sold by
Green Jerry Don and Green Melissa A Lucas
Bought by
Rohlfs Raymond W
Home Financials for this Owner
Home Financials are based on the most recent Mortgage that was taken out on this home.
Original Mortgage
$47,000
Interest Rate
7.12%
Purchase Details
Closed on
Dec 3, 1996
Sold by
Green Carol
Bought by
Green Jerry Don
Create a Home Valuation Report for This Property
The Home Valuation Report is an in-depth analysis detailing your home's value as well as a comparison with similar homes in the area
Home Values in the Area
Average Home Value in this Area
Purchase History
| Date | Buyer | Sale Price | Title Company |
|---|---|---|---|
| Maddux Fred H | -- | American Title | |
| Rohlfs Katherine | -- | -- | |
| Rohlfs Raymond W | -- | Old Republic Title | |
| Green Jerry Don | -- | Trinity Western Title Co |
Source: Public Records
Mortgage History
| Date | Status | Borrower | Loan Amount |
|---|---|---|---|
| Open | Maddux Fred H | $68,000 | |
| Previous Owner | Rohlfs Raymond W | $47,000 |
Source: Public Records
Tax History Compared to Growth
Tax History
| Year | Tax Paid | Tax Assessment Tax Assessment Total Assessment is a certain percentage of the fair market value that is determined by local assessors to be the total taxable value of land and additions on the property. | Land | Improvement |
|---|---|---|---|---|
| 2025 | $462 | $255,276 | $41,760 | $213,516 |
| 2024 | $462 | $255,276 | $41,760 | $213,516 |
| 2023 | $3,229 | $250,222 | $34,800 | $215,422 |
| 2022 | $3,374 | $196,679 | $34,800 | $161,879 |
| 2021 | $3,213 | $141,885 | $20,000 | $121,885 |
| 2020 | $2,914 | $132,346 | $20,000 | $112,346 |
| 2019 | $2,695 | $132,346 | $20,000 | $112,346 |
| 2018 | $891 | $100,091 | $20,000 | $80,091 |
| 2017 | $2,303 | $106,276 | $20,000 | $86,276 |
| 2016 | $2,093 | $86,586 | $20,000 | $66,586 |
| 2015 | $867 | $75,200 | $15,000 | $60,200 |
| 2014 | $867 | $75,200 | $15,000 | $60,200 |
Source: Public Records
Map
Nearby Homes
- 512 Billie Ruth Ln
- 649 Timberline Dr
- 425 Moore Creek Rd
- 405 Billy Creek Cir
- 632 Melbourne Ct
- 913 Zelda Dr
- 741 Ponderosa Dr
- 916 Zelda Dr
- 758 Briarwood Ln
- 756 Briarwood Ln
- 829 Joanna Dr
- 808 Betty Ct
- 1001 Livingston Dr
- 1200 Walker Dr
- 833 W Cheryl Ave
- 1000 Madrid St
- 1304 W Redbud Dr
- 744 Briarwood Ln
- 1016 Billie Ruth Ln
- 1112 Blakey Ct
- 533 Livingston Dr
- 541 Livingston Dr
- 545 Livingston Dr
- 528 Billie Ruth Ln
- 524 Billie Ruth Ln
- 522 Billie Ruth Ln
- 532 Billie Ruth Ln
- 532 Billie Ruth Ln
- 532 Billie Ruth Ln Unit 534
- 536 Livingston Dr
- 540 Livingston Dr
- 532 Livingston Dr
- 549 Livingston Dr
- 525 Livingston Dr
- 520 Billie Ruth Ln
- 544 Livingston Dr
- 528 Livingston Dr
- 536 Billie Ruth Ln
- 536 Billie Ruth Ln Unit 538
- 518 Billie Ruth Ln