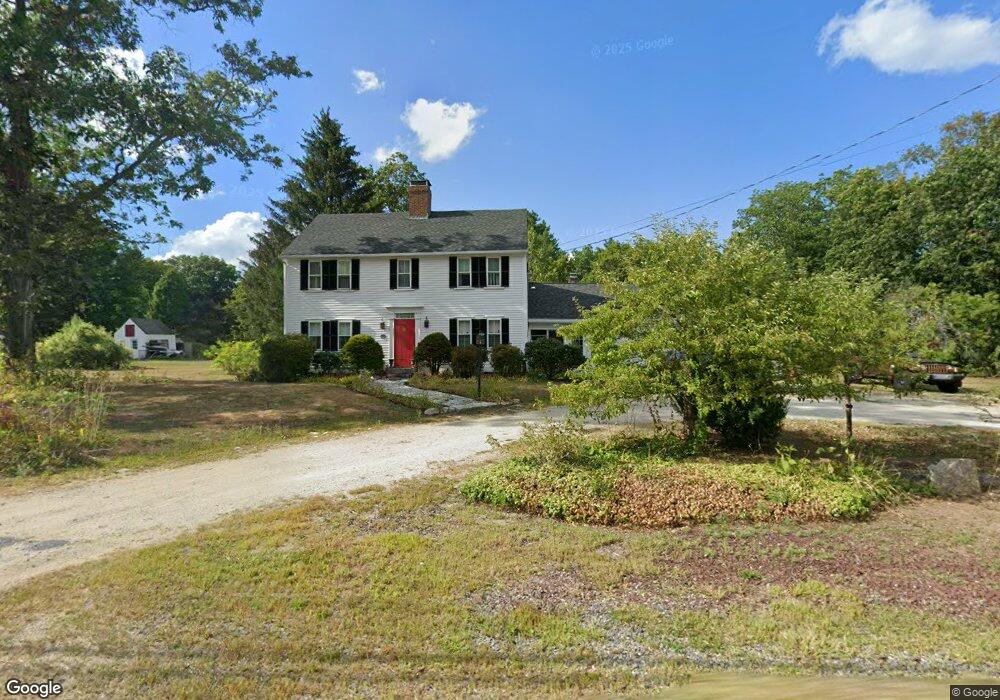
537 Main St West Townsend, MA 01474
Estimated Value: $495,000 - $595,000
3
Beds
2
Baths
1,952
Sq Ft
$273/Sq Ft
Est. Value
About This Home
This home is located at 537 Main St, West Townsend, MA 01474 and is currently estimated at $533,850, approximately $273 per square foot. 537 Main St is a home located in Middlesex County with nearby schools including North Middlesex Regional High School.
Ownership History
Date
Name
Owned For
Owner Type
Purchase Details
Closed on
Feb 11, 2020
Sold by
Boundy Paul F and Boundy Cynthia M
Bought by
Boundy Ft
Current Estimated Value
Create a Home Valuation Report for This Property
The Home Valuation Report is an in-depth analysis detailing your home's value as well as a comparison with similar homes in the area
Home Values in the Area
Average Home Value in this Area
Purchase History
| Date | Buyer | Sale Price | Title Company |
|---|---|---|---|
| Boundy Ft | -- | None Available |
Source: Public Records
Tax History
| Year | Tax Paid | Tax Assessment Tax Assessment Total Assessment is a certain percentage of the fair market value that is determined by local assessors to be the total taxable value of land and additions on the property. | Land | Improvement |
|---|---|---|---|---|
| 2025 | $6,495 | $447,300 | $96,300 | $351,000 |
| 2024 | $6,327 | $439,100 | $96,300 | $342,800 |
| 2023 | $6,302 | $413,000 | $83,300 | $329,700 |
| 2022 | $6,079 | $345,200 | $76,100 | $269,100 |
| 2021 | $5,906 | $322,200 | $75,200 | $247,000 |
| 2020 | $5,801 | $297,200 | $68,200 | $229,000 |
| 2019 | $5,712 | $295,500 | $68,200 | $227,300 |
| 2018 | $5,187 | $256,000 | $61,300 | $194,700 |
| 2017 | $4,835 | $245,800 | $64,200 | $181,600 |
| 2016 | $4,673 | $236,000 | $64,200 | $171,800 |
| 2015 | $4,583 | $239,800 | $71,200 | $168,600 |
| 2014 | $4,476 | $228,700 | $66,900 | $161,800 |
Source: Public Records
Map
Nearby Homes
- 2 W Meadow Rd
- 86 W Elm Lunenburg Rd Blood Rd
- 9 Kaneohe Ct
- 359 Main St
- 0 W Main St
- 16 Worcester Rd
- 531 Mason Rd
- 5 Turnpike Rd Unit 213 TWO
- 632 Main St
- 662 Main St
- 1235 Townsend Rd
- 44.5 Allen Rd
- 1 Depot Street Extension Unit 5
- 1 Depot Street Extension Unit 2
- 1 Depot Street Extension Unit 4
- 149 New Ipswich Rd
- 0 Frost Rd
- 74 Wright Rd
- 0 Tract of Land Unit 73451879
- 791 Main St
Your Personal Tour Guide
Ask me questions while you tour the home.