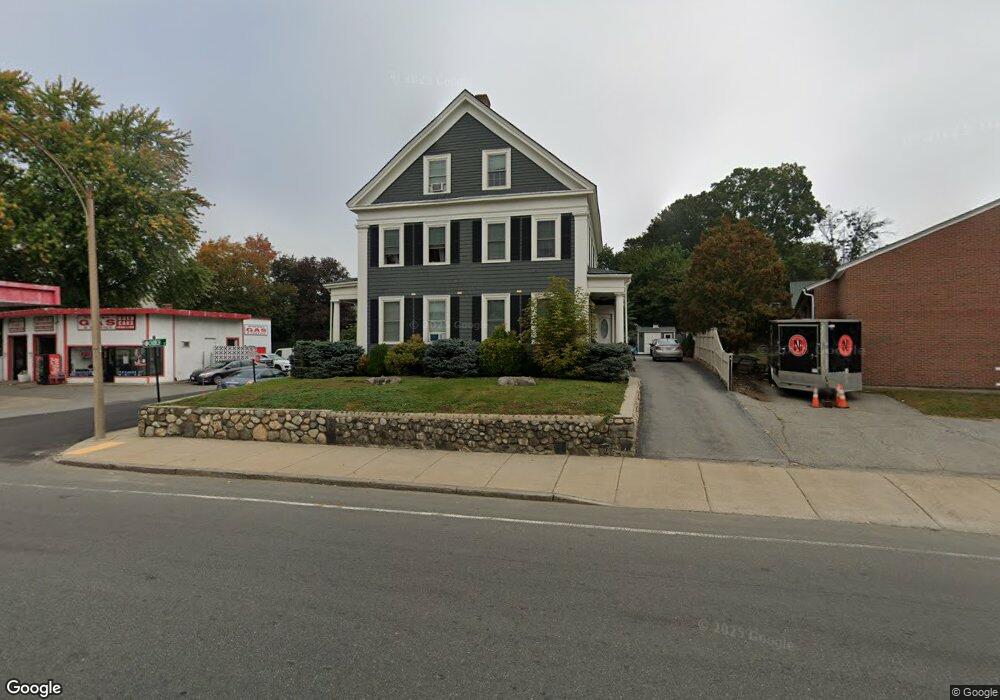
537 Main St Woburn, MA 01801
Downtown Woburn NeighborhoodEstimated Value: $767,000 - $1,144,000
1
Bed
4
Baths
500
Sq Ft
$1,967/Sq Ft
Est. Value
About This Home
Available now - Cozy 1bedroom with closet, 1 bath apartment, nice sized living room and kitchen. Off Main st. Includes Parking and w/d included.
Ownership History
Date
Name
Owned For
Owner Type
Purchase Details
Closed on
Jun 24, 2010
Sold by
Spinazola Victor and Fuccione Andria
Bought by
Krempin Matthew Louis
Current Estimated Value
Home Financials for this Owner
Home Financials are based on the most recent Mortgage that was taken out on this home.
Original Mortgage
$417,000
Outstanding Balance
$279,611
Interest Rate
4.98%
Mortgage Type
Purchase Money Mortgage
Estimated Equity
$703,935
Create a Home Valuation Report for This Property
The Home Valuation Report is an in-depth analysis detailing your home's value as well as a comparison with similar homes in the area
Home Values in the Area
Average Home Value in this Area
Purchase History
| Date | Buyer | Sale Price | Title Company |
|---|---|---|---|
| Krempin Matthew Louis | $445,000 | -- | |
| Krempin Matthew Louis | $445,000 | -- |
Source: Public Records
Mortgage History
| Date | Status | Borrower | Loan Amount |
|---|---|---|---|
| Open | Krempin Matthew Louis | $417,000 | |
| Closed | Krempin Matthew Louis | $417,000 |
Source: Public Records
Property History
| Date | Event | Price | List to Sale | Price per Sq Ft |
|---|---|---|---|---|
| 09/07/2024 09/07/24 | For Rent | $2,000 | -- | -- |
Tax History Compared to Growth
Tax History
| Year | Tax Paid | Tax Assessment Tax Assessment Total Assessment is a certain percentage of the fair market value that is determined by local assessors to be the total taxable value of land and additions on the property. | Land | Improvement |
|---|---|---|---|---|
| 2025 | $7,867 | $921,200 | $272,200 | $649,000 |
| 2024 | $7,185 | $891,500 | $259,300 | $632,200 |
| 2023 | $7,318 | $841,100 | $235,700 | $605,400 |
| 2022 | $6,755 | $723,200 | $204,900 | $518,300 |
| 2021 | $6,657 | $713,500 | $195,200 | $518,300 |
| 2020 | $5,714 | $613,100 | $195,200 | $417,900 |
| 2019 | $5,163 | $543,500 | $185,900 | $357,600 |
| 2018 | $5,055 | $511,100 | $170,500 | $340,600 |
| 2017 | $4,932 | $496,200 | $162,400 | $333,800 |
| 2016 | $4,679 | $465,600 | $151,800 | $313,800 |
| 2015 | $4,613 | $453,600 | $141,900 | $311,700 |
| 2014 | $4,526 | $433,500 | $141,900 | $291,600 |
Source: Public Records
Map
Nearby Homes
- 537 Main St Unit 3
- 537 Main St Unit b
- 537 Main St Unit 1
- 537 Main St
- 537 Main St Unit 2
- 5 Church St
- 7 Church St
- 7 Church St Unit 7
- 7 Church St Unit 1
- 546 Main St
- 544 Main St Unit 2
- 544 Main St Unit 1
- 544 Main St
- 11 Church St
- 2 Plympton St
- 538 Main St
- 8 Davis St
- 536 Main St
- 536 Main St Unit E
- 536 Main St Unit C