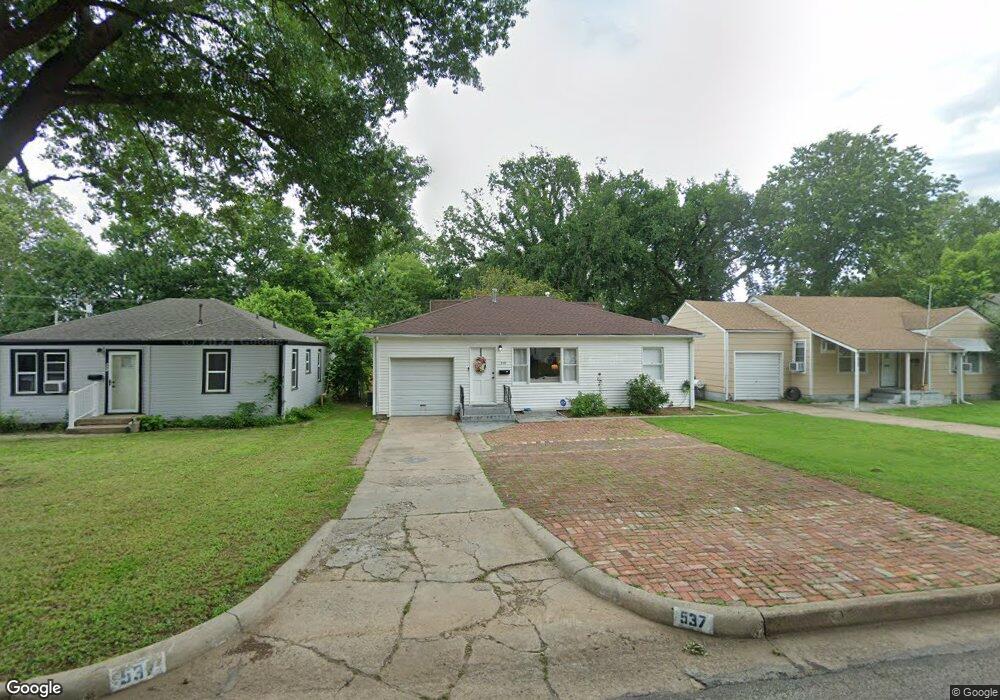
537 N 12th St Ponca City, OK 74601
Estimated Value: $124,000 - $136,724
3
Beds
2
Baths
1,350
Sq Ft
$97/Sq Ft
Est. Value
About This Home
This home is located at 537 N 12th St, Ponca City, OK 74601 and is currently estimated at $131,431, approximately $97 per square foot. 537 N 12th St is a home located in Kay County with nearby schools including Roosevelt Elementary School, Ponca City East Middle School, and Ponca City West Middle School.
Ownership History
Date
Name
Owned For
Owner Type
Purchase Details
Closed on
Jan 4, 2024
Sold by
Hawkins Cody
Bought by
Grubbs Inflissa L
Current Estimated Value
Home Financials for this Owner
Home Financials are based on the most recent Mortgage that was taken out on this home.
Original Mortgage
$90,000
Outstanding Balance
$88,524
Interest Rate
7.29%
Mortgage Type
New Conventional
Estimated Equity
$42,907
Purchase Details
Closed on
Sep 2, 2003
Sold by
Jessica Mark and Jessica Avila
Bought by
Nancy Mc Millan
Purchase Details
Closed on
Mar 28, 2002
Sold by
Lois Lamb
Bought by
Jessica Mark and Jessica Avila
Purchase Details
Closed on
Jan 11, 2000
Sold by
Lois Elmer L and Lois Lamb
Bought by
Elmer L Lamb
Purchase Details
Closed on
Jun 2, 1994
Sold by
Elmer L Lamb
Bought by
Lamb Elmer L and Lamb Lois A
Purchase Details
Closed on
Dec 21, 1990
Sold by
Wessie Suttle Revoc Trust
Bought by
Lamb Elmer L and Lamb Veda L
Create a Home Valuation Report for This Property
The Home Valuation Report is an in-depth analysis detailing your home's value as well as a comparison with similar homes in the area
Home Values in the Area
Average Home Value in this Area
Purchase History
| Date | Buyer | Sale Price | Title Company |
|---|---|---|---|
| Grubbs Inflissa L | $120,000 | None Listed On Document | |
| Nancy Mc Millan | $51,000 | -- | |
| Jessica Mark | $47,500 | -- | |
| Elmer L Lamb | -- | -- | |
| Lamb Elmer L | -- | -- | |
| Lamb Elmer L | $34,000 | -- |
Source: Public Records
Mortgage History
| Date | Status | Borrower | Loan Amount |
|---|---|---|---|
| Open | Grubbs Inflissa L | $90,000 |
Source: Public Records
Tax History Compared to Growth
Tax History
| Year | Tax Paid | Tax Assessment Tax Assessment Total Assessment is a certain percentage of the fair market value that is determined by local assessors to be the total taxable value of land and additions on the property. | Land | Improvement |
|---|---|---|---|---|
| 2024 | $479 | $5,060 | $428 | $4,632 |
| 2023 | $479 | $6,604 | $562 | $6,042 |
| 2022 | $598 | $6,289 | $562 | $5,727 |
| 2021 | $602 | $6,289 | $562 | $5,727 |
| 2020 | $592 | $6,253 | $562 | $5,691 |
| 2019 | $569 | $5,956 | $562 | $5,394 |
| 2018 | $586 | $6,049 | $562 | $5,487 |
| 2017 | $593 | $6,049 | $562 | $5,487 |
| 2016 | $599 | $6,049 | $562 | $5,487 |
| 2015 | $591 | $5,945 | $562 | $5,383 |
| 2014 | $579 | $5,931 | $562 | $5,369 |
Source: Public Records
Map
Nearby Homes
- 525 Monument Rd
- 410 Drake Dr
- 216 N 12th St Unit 840
- 213 N 10th St
- 214 Virginia Ave
- 106 Elmwood Ave
- 310 N 7th St Unit 660
- 202 N 7th St
- 800 Sugar Maple Dr
- 409 N 5th St
- 121 Hillside Ave
- 310 S 9th St
- 734 E Albany Ave
- 417 N 3rd St
- 1013 N 7th St
- 920 N 4th St
- 701 S 8th St
- 408 S 4th St
- 1412 Donahoe Dr
- 800 S 12th St