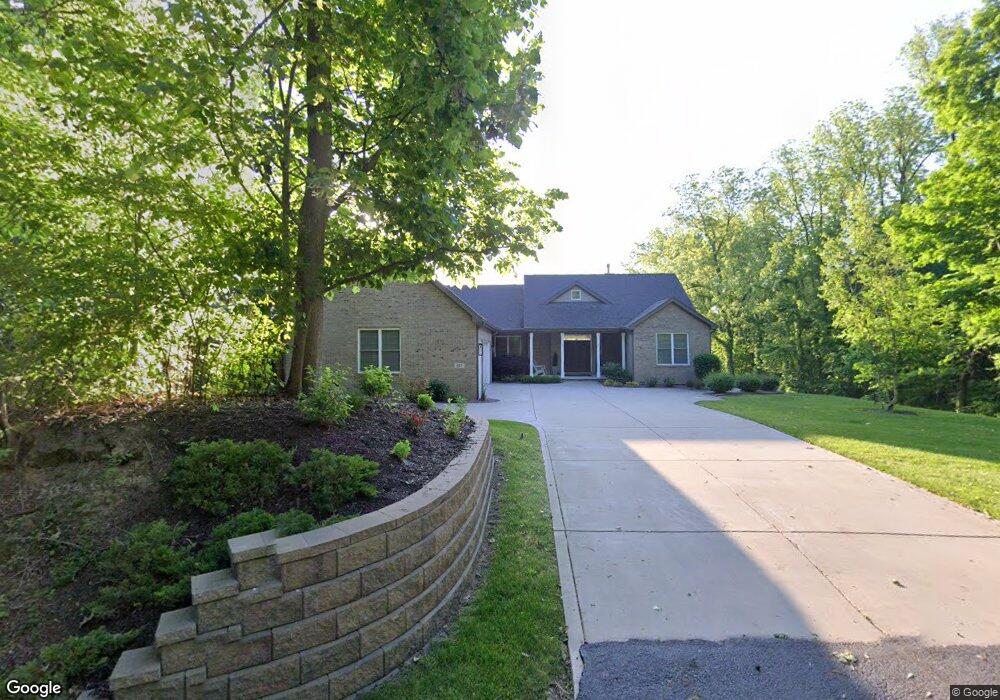
537 N 450 E Valparaiso, IN 46383
Porter County NeighborhoodEstimated Value: $707,000 - $881,353
3
Beds
4
Baths
2,661
Sq Ft
$296/Sq Ft
Est. Value
About This Home
This home is located at 537 N 450 E, Valparaiso, IN 46383 and is currently estimated at $788,588, approximately $296 per square foot. 537 N 450 E is a home located in Porter County with nearby schools including Washington Township Elementary School and Washington Township Middle/High School.
Ownership History
Date
Name
Owned For
Owner Type
Purchase Details
Closed on
Jul 30, 2018
Sold by
Ahlgren Warren K and Kurfman Rebecca S
Bought by
Ahlgren Warren K and Ahlgren Rebecca S
Current Estimated Value
Home Financials for this Owner
Home Financials are based on the most recent Mortgage that was taken out on this home.
Original Mortgage
$425,000
Outstanding Balance
$364,436
Interest Rate
4.5%
Mortgage Type
Future Advance Clause Open End Mortgage
Estimated Equity
$424,152
Purchase Details
Closed on
Sep 25, 2007
Sold by
Bierma Arthur and Bierma Virginia
Bought by
Ahlgren Warren K and Kurfman Rebecca S
Home Financials for this Owner
Home Financials are based on the most recent Mortgage that was taken out on this home.
Original Mortgage
$48,000
Interest Rate
6.66%
Mortgage Type
Purchase Money Mortgage
Create a Home Valuation Report for This Property
The Home Valuation Report is an in-depth analysis detailing your home's value as well as a comparison with similar homes in the area
Home Values in the Area
Average Home Value in this Area
Purchase History
We collect this data history from publicly available records. To have your information removed, we recommend requesting removal directly through your county’s website.
| Date | Buyer | Sale Price | Title Company |
|---|---|---|---|
| Ahlgren Warren K | -- | Community Title Co | |
| Ahlgren Warren K | -- | Chicago Title Insurance Co |
Source: Public Records
Mortgage History
We collect this data history from publicly available records. To have your information removed, we recommend requesting removal directly through your county’s website.
| Date | Status | Borrower | Loan Amount |
|---|---|---|---|
| Open | Ahlgren Warren K | $425,000 | |
| Closed | Ahlgren Warren K | $48,000 |
Source: Public Records
Tax History
| Year | Tax Paid | Tax Assessment Tax Assessment Total Assessment is a certain percentage of the fair market value that is determined by local assessors to be the total taxable value of land and additions on the property. | Land | Improvement |
|---|---|---|---|---|
| 2025 | $6,346 | $856,200 | $67,600 | $788,600 |
| 2024 | $6,723 | $827,300 | $58,900 | $768,400 |
| 2023 | $6,583 | $819,600 | $56,600 | $763,000 |
| 2022 | $6,370 | $744,200 | $56,600 | $687,600 |
| 2021 | $6,745 | $725,500 | $56,600 | $668,900 |
| 2020 | $5,984 | $666,200 | $48,900 | $617,300 |
| 2019 | $5,946 | $641,800 | $48,900 | $592,900 |
| 2018 | $5,651 | $621,200 | $48,900 | $572,300 |
| 2017 | $5,482 | $609,800 | $48,900 | $560,900 |
| 2016 | $4,304 | $519,200 | $62,700 | $456,500 |
| 2014 | $3,119 | $358,500 | $58,100 | $300,400 |
| 2013 | -- | $55,200 | $55,200 | $0 |
Source: Public Records
Map
Nearby Homes
- 500 N
- 361 Sandwood Ct
- 539 N 300 E
- 545 N 300 E
- 365 Newton Ln
- 520 E 700 N
- 380 E Augustine Dr
- 125 Bellflower Dr
- 441 Meadowbrook Dr
- 718 N Old Suman Rd
- 692 Harvest Rd
- 467 N 211 E
- 4010 Crown Dr
- 2901 Hillard St
- 3911 Crown Dr
- 2403-2405 Linda Rd
- Blue Grouse St
- 2704 Kellee Ct
- 370 E US Highway 6
- 3302 Kestrel St
Your Personal Tour Guide
Ask me questions while you tour the home.