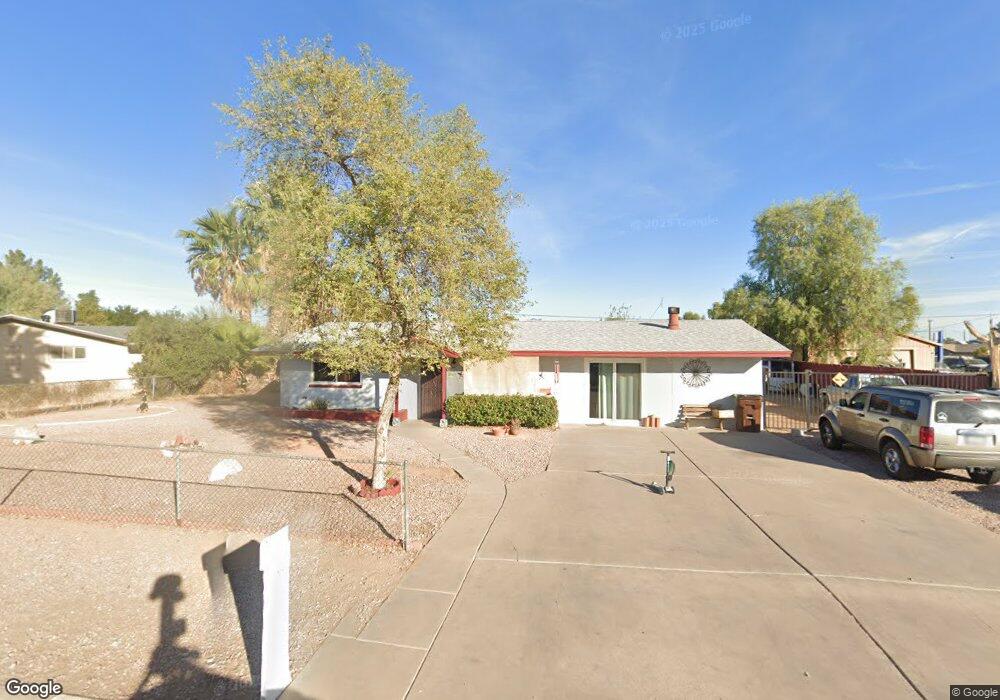
537 N 97th Place Mesa, AZ 85207
Northeast Mesa NeighborhoodEstimated Value: $301,010 - $441,000
Studio
1
Bath
1,626
Sq Ft
$241/Sq Ft
Est. Value
About This Home
This home is located at 537 N 97th Place, Mesa, AZ 85207 and is currently estimated at $391,753, approximately $240 per square foot. 537 N 97th Place is a home located in Maricopa County with nearby schools including Taft Elementary School, Franklin at Brimhall Elementary School, and Franklin West Elementary School.
Ownership History
Date
Name
Owned For
Owner Type
Purchase Details
Closed on
Feb 7, 2021
Sold by
Branham Mary B
Bought by
Branham Seana
Current Estimated Value
Purchase Details
Closed on
Apr 15, 2019
Sold by
Branham James T
Bought by
Branham Mary B
Purchase Details
Closed on
Aug 18, 2017
Sold by
Branham Mary B
Bought by
Branham James T
Purchase Details
Closed on
Nov 17, 2010
Sold by
Branham Mary B and Branham Brooks Pam
Bought by
Branham Mary B
Purchase Details
Closed on
Nov 6, 2007
Sold by
Branham Mary B
Bought by
Brooks Pam Branham and Branham Tim
Purchase Details
Closed on
Mar 1, 2006
Sold by
Collins Joan K
Bought by
Collins Joan K
Purchase Details
Closed on
Feb 28, 2005
Sold by
Collins Joan
Bought by
Collins Joan K and The Joan K Collins Family Trust
Purchase Details
Closed on
Dec 17, 2002
Sold by
Branham James
Bought by
Branham Mary B
Create a Home Valuation Report for This Property
The Home Valuation Report is an in-depth analysis detailing your home's value as well as a comparison with similar homes in the area
Home Values in the Area
Average Home Value in this Area
Purchase History
| Date | Buyer | Sale Price | Title Company |
|---|---|---|---|
| Branham Seana | -- | None Available | |
| Branham Mary B | -- | None Available | |
| Branham James T | -- | None Available | |
| Branham Mary B | -- | None Available | |
| Brooks Pam Branham | -- | None Available | |
| Collins Joan K | -- | Chicago Title Insurance Co | |
| Collins Joan K | -- | -- | |
| Branham Mary B | -- | None Available |
Source: Public Records
Tax History Compared to Growth
Tax History
| Year | Tax Paid | Tax Assessment Tax Assessment Total Assessment is a certain percentage of the fair market value that is determined by local assessors to be the total taxable value of land and additions on the property. | Land | Improvement |
|---|---|---|---|---|
| 2025 | $676 | $9,068 | -- | -- |
| 2024 | $691 | $8,636 | -- | -- |
| 2023 | $691 | $29,460 | $5,890 | $23,570 |
| 2022 | $674 | $22,460 | $4,490 | $17,970 |
| 2021 | $681 | $20,810 | $4,160 | $16,650 |
| 2020 | $676 | $18,730 | $3,740 | $14,990 |
| 2019 | $620 | $16,360 | $3,270 | $13,090 |
| 2018 | $603 | $13,880 | $2,770 | $11,110 |
| 2017 | $580 | $12,300 | $2,460 | $9,840 |
| 2016 | $568 | $10,080 | $2,010 | $8,070 |
| 2015 | $533 | $8,760 | $1,750 | $7,010 |
Source: Public Records
Map
Nearby Homes
- 528 N 97th St
- 9821 E University Dr
- 9554 E Dallas St
- 9638 E Adobe Rd
- 529 N 95th St
- 636 N 94th Way
- 9510 E Duncan St
- 850 N 97th St
- 9427 E University Dr Unit 36
- 9427 E University Dr Unit 48
- 604 N 101st Place
- 9403 E Cisco Rd
- 902 N 96th St
- 9339 E Contessa Cir
- 10319 S Dutchman Dr
- 10282 S Dutchman Dr
- 10274 S Dutchman Dr
- 10325 S Cave Spring Trail
- 518 W Fremont Pass
- 10238 S Dutchman Dr
- 545 N 97th Place
- 527 N 97th Place
- 538 N 98th St
- 548 N 98th St
- 528 N 98th St
- 538 N 97th Place
- 519 N 97th Place
- 546 N 97th St
- 546 N 97th Place
- 528 N 97th Place
- 520 N 98th St
- 520 N 97th Place
- 509 N 97th Place
- 9726 E Quarterline Rd
- 510 N 98th St
- 539 N 98th St
- 537 N 97th St
- 510 N 97th Place
- 527 N 98th St
- 545 N 97th St