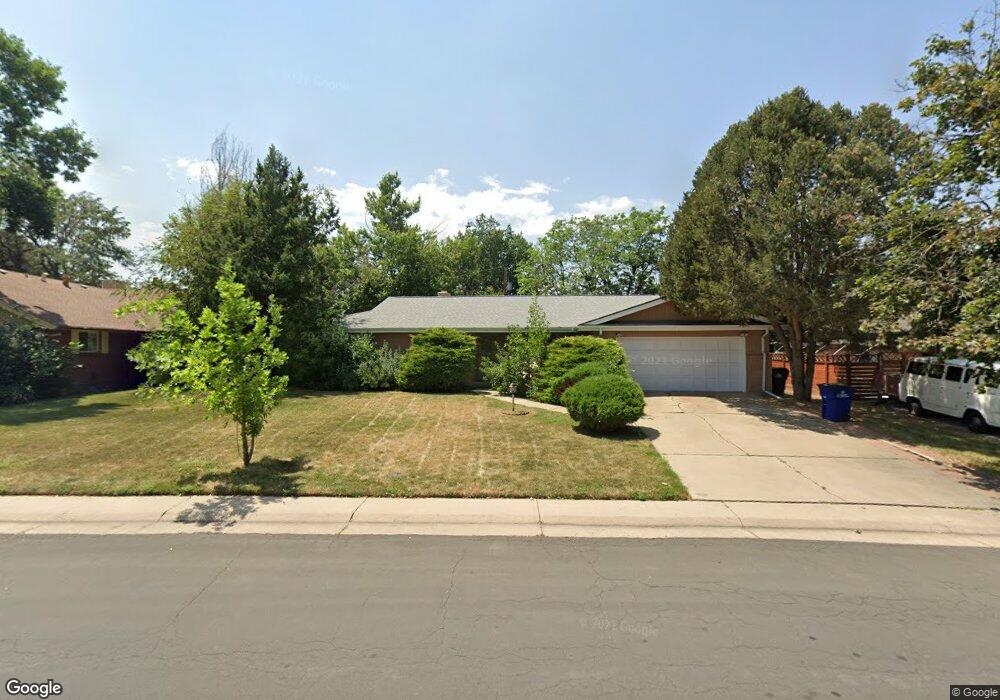
537 Oakland Ct Aurora, CO 80010
Highland Park NeighborhoodEstimated Value: $448,971 - $503,000
Studio
2
Baths
1,971
Sq Ft
$244/Sq Ft
Est. Value
About This Home
This home is located at 537 Oakland Ct, Aurora, CO 80010 and is currently estimated at $480,993, approximately $244 per square foot. 537 Oakland Ct is a home located in Arapahoe County with nearby schools including Lansing Elementary Community School, Aurora Hills Middle School, and Aurora Central High School.
Ownership History
Date
Name
Owned For
Owner Type
Purchase Details
Closed on
Dec 13, 2022
Sold by
Baldwin Lee F
Bought by
Lfb Property 1 Llc
Current Estimated Value
Purchase Details
Closed on
Apr 12, 2002
Sold by
Foreman Royal J and Foreman Frances L
Bought by
Baldwin Lee F and Baldwin Shanda L
Purchase Details
Closed on
Jul 12, 1996
Sold by
Brooks Leonor M and Brooks Earl
Bought by
Foreman Royal J and Foreman Frances L
Home Financials for this Owner
Home Financials are based on the most recent Mortgage that was taken out on this home.
Original Mortgage
$104,243
Interest Rate
8.41%
Mortgage Type
FHA
Purchase Details
Closed on
Dec 30, 1986
Sold by
Conversion Arapco
Bought by
Brooks Earl
Purchase Details
Closed on
Jul 4, 1776
Bought by
Conversion Arapco
Create a Home Valuation Report for This Property
The Home Valuation Report is an in-depth analysis detailing your home's value as well as a comparison with similar homes in the area
Home Values in the Area
Average Home Value in this Area
Purchase History
| Date | Buyer | Sale Price | Title Company |
|---|---|---|---|
| Lfb Property 1 Llc | -- | -- | |
| Baldwin Lee F | $203,000 | Guardian Title Agency Llc | |
| Foreman Royal J | $105,000 | -- | |
| Brooks Earl | -- | -- | |
| Conversion Arapco | -- | -- |
Source: Public Records
Mortgage History
| Date | Status | Borrower | Loan Amount |
|---|---|---|---|
| Previous Owner | Foreman Royal J | $104,243 |
Source: Public Records
Tax History
| Year | Tax Paid | Tax Assessment Tax Assessment Total Assessment is a certain percentage of the fair market value that is determined by local assessors to be the total taxable value of land and additions on the property. | Land | Improvement |
|---|---|---|---|---|
| 2025 | $2,804 | $28,281 | -- | -- |
| 2024 | $2,719 | $29,259 | -- | -- |
| 2023 | $2,719 | $29,259 | $0 | $0 |
| 2022 | $2,415 | $24,048 | $0 | $0 |
| 2021 | $2,493 | $24,048 | $0 | $0 |
| 2020 | $2,771 | $26,613 | $0 | $0 |
| 2019 | $2,756 | $26,613 | $0 | $0 |
| 2018 | $2,078 | $19,649 | $0 | $0 |
| 2017 | $1,807 | $19,649 | $0 | $0 |
| 2016 | $1,707 | $18,165 | $0 | $0 |
| 2015 | $1,647 | $18,165 | $0 | $0 |
| 2014 | $1,109 | $11,781 | $0 | $0 |
| 2013 | -- | $13,620 | $0 | $0 |
Source: Public Records
Map
Nearby Homes
- 531 Nome St
- 11906 E Canal Dr
- 800 Nile St
- 11612 Del Mar Pkwy
- 234 Nome St
- 740 Newark St
- 143 Oakland Ct
- 12061 E 3rd Ave
- 141 Oakland Ct
- 740 Moline St
- 11718 E Canal Dr
- 12054 E 3rd Ave
- 12113 E 2nd Dr
- 855 Newark St
- 765 Moline St
- 84 Nome Way Unit C
- 12106 E 2nd Dr
- 92 Newark St Unit A
- 252 Quari St
- 64 Nome Way Unit A
Your Personal Tour Guide
Ask me questions while you tour the home.