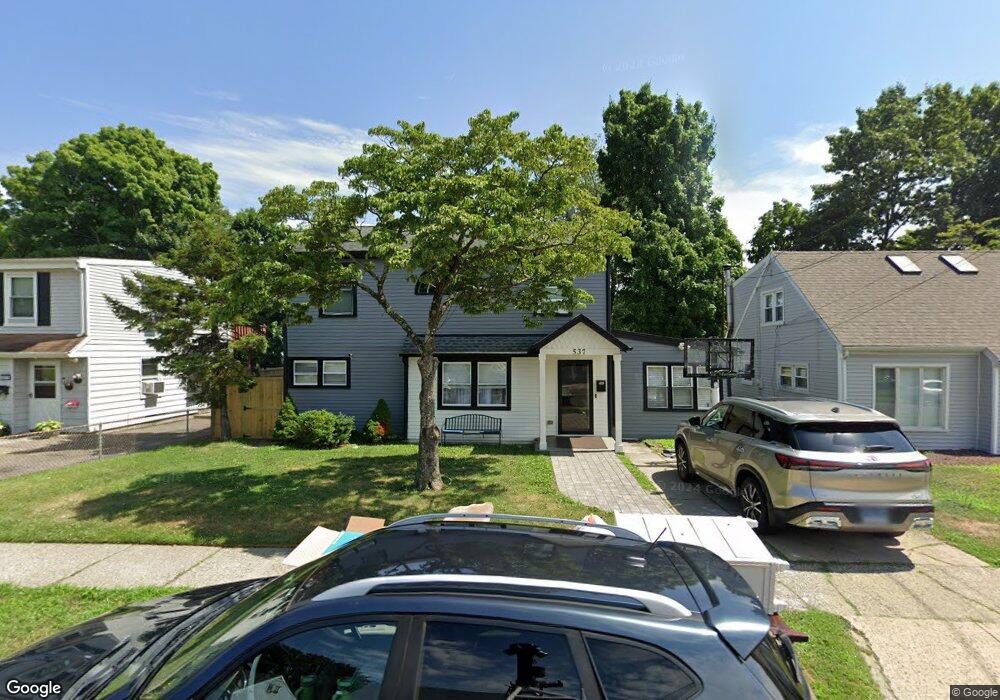
537 Queen St Bridgeport, CT 06606
North End NeighborhoodEstimated Value: $408,000 - $479,000
5
Beds
2
Baths
1,910
Sq Ft
$239/Sq Ft
Est. Value
About This Home
This home is located at 537 Queen St, Bridgeport, CT 06606 and is currently estimated at $456,473, approximately $238 per square foot. 537 Queen St is a home located in Fairfield County with nearby schools including Blackham School, Central High School, and The Unquowa School.
Ownership History
Date
Name
Owned For
Owner Type
Purchase Details
Closed on
Nov 10, 2022
Sold by
Wooten Eddie
Bought by
Mcelveen Betty W and Mcelveen Mark
Current Estimated Value
Purchase Details
Closed on
Oct 31, 2005
Sold by
Dibiagio Girardo
Bought by
Wooten Eddie and Wooten Louise
Home Financials for this Owner
Home Financials are based on the most recent Mortgage that was taken out on this home.
Original Mortgage
$164,000
Interest Rate
5.79%
Mortgage Type
Purchase Money Mortgage
Create a Home Valuation Report for This Property
The Home Valuation Report is an in-depth analysis detailing your home's value as well as a comparison with similar homes in the area
Home Values in the Area
Average Home Value in this Area
Purchase History
| Date | Buyer | Sale Price | Title Company |
|---|---|---|---|
| Mcelveen Betty W | -- | None Available | |
| Mcelveen Betty W | -- | None Available | |
| Wooten Eddie | $233,000 | -- | |
| Wooten Eddie | $233,000 | -- |
Source: Public Records
Mortgage History
| Date | Status | Borrower | Loan Amount |
|---|---|---|---|
| Previous Owner | Wooten Eddie | $164,000 | |
| Previous Owner | Wooten Eddie | $38,000 |
Source: Public Records
Tax History Compared to Growth
Tax History
| Year | Tax Paid | Tax Assessment Tax Assessment Total Assessment is a certain percentage of the fair market value that is determined by local assessors to be the total taxable value of land and additions on the property. | Land | Improvement |
|---|---|---|---|---|
| 2025 | $8,284 | $190,650 | $75,310 | $115,340 |
| 2024 | $8,284 | $190,650 | $75,310 | $115,340 |
| 2023 | $8,284 | $190,650 | $75,310 | $115,340 |
| 2022 | $8,284 | $190,650 | $75,310 | $115,340 |
| 2021 | $8,284 | $190,650 | $75,310 | $115,340 |
| 2020 | $8,113 | $150,260 | $43,270 | $106,990 |
| 2019 | $8,113 | $150,260 | $43,270 | $106,990 |
| 2018 | $8,170 | $150,260 | $43,270 | $106,990 |
| 2017 | $8,170 | $150,260 | $43,270 | $106,990 |
| 2016 | $8,170 | $150,260 | $43,270 | $106,990 |
| 2015 | $7,436 | $176,200 | $49,980 | $126,220 |
| 2014 | $4,998 | $118,430 | $49,980 | $68,450 |
Source: Public Records
Map
Nearby Homes
- 375 Ruth St
- 605 Merritt St
- 604 Birmingham St
- 38 Enid St Unit B
- 339 Goldenrod Ave
- 720 Queen St
- 495 Peet St
- 2346 Madison Ave
- 81 Ameridge Dr
- 245 Glendale Ave Unit D8
- 214 Burnsford Ave
- 783 Clark St
- 184 Merritt St
- 69 Plankton St
- 1095 Wayne St
- 260 Birmingham St
- 129 Ashton St
- 932 Thorme St
- 520 Savoy St
- 12 Riverview Dr Unit 12