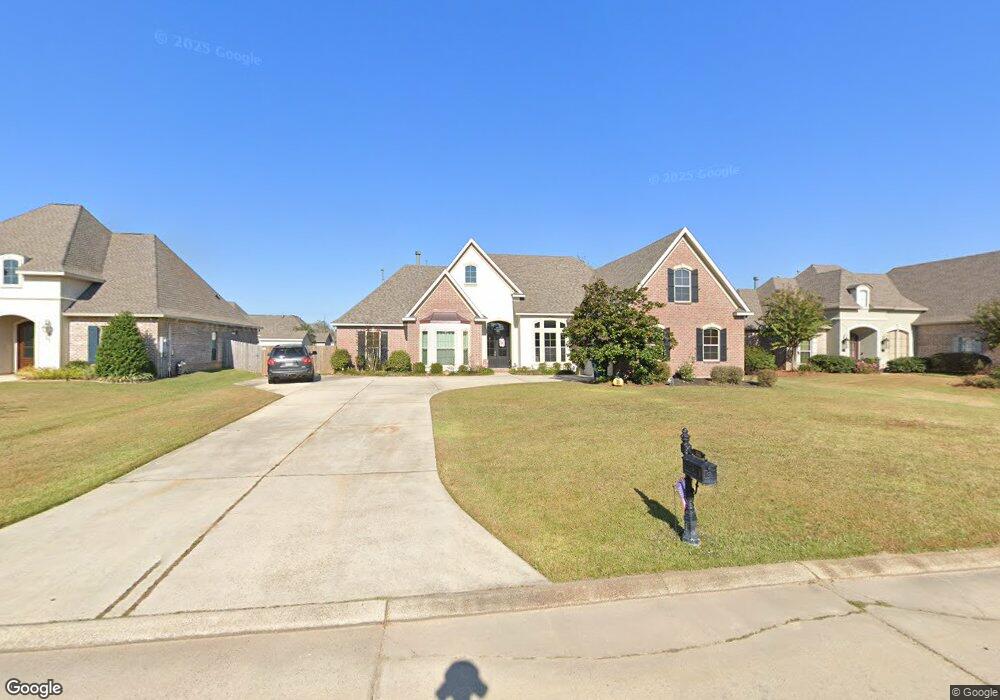
537 S Caleb Dr Slidell, LA 70461
Estimated Value: $511,000 - $576,000
4
Beds
4
Baths
3,624
Sq Ft
$150/Sq Ft
Est. Value
About This Home
This home is located at 537 S Caleb Dr, Slidell, LA 70461 and is currently estimated at $542,513, approximately $149 per square foot. 537 S Caleb Dr is a home located in St. Tammany Parish with nearby schools including Cypress Cove Elementary School, Honey Island Elementary School, and Little Oak Middle School.
Ownership History
Date
Name
Owned For
Owner Type
Purchase Details
Closed on
Feb 4, 2021
Sold by
Raney Jace and Raney Emily
Bought by
Herdliska George and Herdliska Robin
Current Estimated Value
Home Financials for this Owner
Home Financials are based on the most recent Mortgage that was taken out on this home.
Original Mortgage
$245,000
Interest Rate
2.9%
Mortgage Type
New Conventional
Purchase Details
Closed on
Sep 30, 2015
Sold by
Atkinson Robert C and Atkinson Alison C
Bought by
Raney Jace and Raney Emily
Home Financials for this Owner
Home Financials are based on the most recent Mortgage that was taken out on this home.
Original Mortgage
$348,000
Interest Rate
3.97%
Mortgage Type
New Conventional
Create a Home Valuation Report for This Property
The Home Valuation Report is an in-depth analysis detailing your home's value as well as a comparison with similar homes in the area
Home Values in the Area
Average Home Value in this Area
Purchase History
| Date | Buyer | Sale Price | Title Company |
|---|---|---|---|
| Herdliska George | $445,000 | None Available | |
| Raney Jace | $435,000 | Fidelity National Title |
Source: Public Records
Mortgage History
| Date | Status | Borrower | Loan Amount |
|---|---|---|---|
| Previous Owner | Herdliska George | $245,000 | |
| Previous Owner | Raney Jace | $348,000 |
Source: Public Records
Tax History
| Year | Tax Paid | Tax Assessment Tax Assessment Total Assessment is a certain percentage of the fair market value that is determined by local assessors to be the total taxable value of land and additions on the property. | Land | Improvement |
|---|---|---|---|---|
| 2025 | $5,475 | $50,508 | $7,931 | $42,577 |
| 2024 | $5,475 | $46,250 | $7,931 | $38,319 |
| 2023 | $5,139 | $39,481 | $7,931 | $31,550 |
| 2022 | $460,592 | $39,481 | $7,931 | $31,550 |
| 2021 | $4,600 | $39,481 | $7,931 | $31,550 |
| 2020 | $4,576 | $39,481 | $7,931 | $31,550 |
| 2019 | $5,674 | $38,331 | $7,700 | $30,631 |
| 2018 | $5,696 | $38,331 | $7,700 | $30,631 |
| 2017 | $5,733 | $38,331 | $7,700 | $30,631 |
| 2016 | $5,869 | $38,331 | $7,700 | $30,631 |
| 2015 | $4,390 | $35,456 | $5,000 | $30,456 |
| 2014 | $4,333 | $35,456 | $5,000 | $30,456 |
| 2013 | -- | $35,456 | $5,000 | $30,456 |
Source: Public Records
Map
Nearby Homes
- 505 Guthrie Dr
- 509 Guthrie Dr
- 530 N Caleb Dr
- 713 Hyatt Ct
- 709 Hyatt Ct
- 526 N Caleb Dr
- 932 Holland Way
- 258 La Chenier Dr
- 221 La Chenier Dr
- 241 La Chenier Dr
- 209 La Chenier Dr
- 217 La Chenier Dr
- 270 La Chenier Dr
- 302 La Chenier Dr
- 294 La Chenier Dr
- 245 La Chenier Dr
- 208 La Chenier Dr
- 281 La Chenier Dr
- 253 La Chenier Dr
Your Personal Tour Guide
Ask me questions while you tour the home.