Estimated Value: $463,000 - $510,000
6
Beds
3
Baths
2,624
Sq Ft
$184/Sq Ft
Est. Value
About This Home
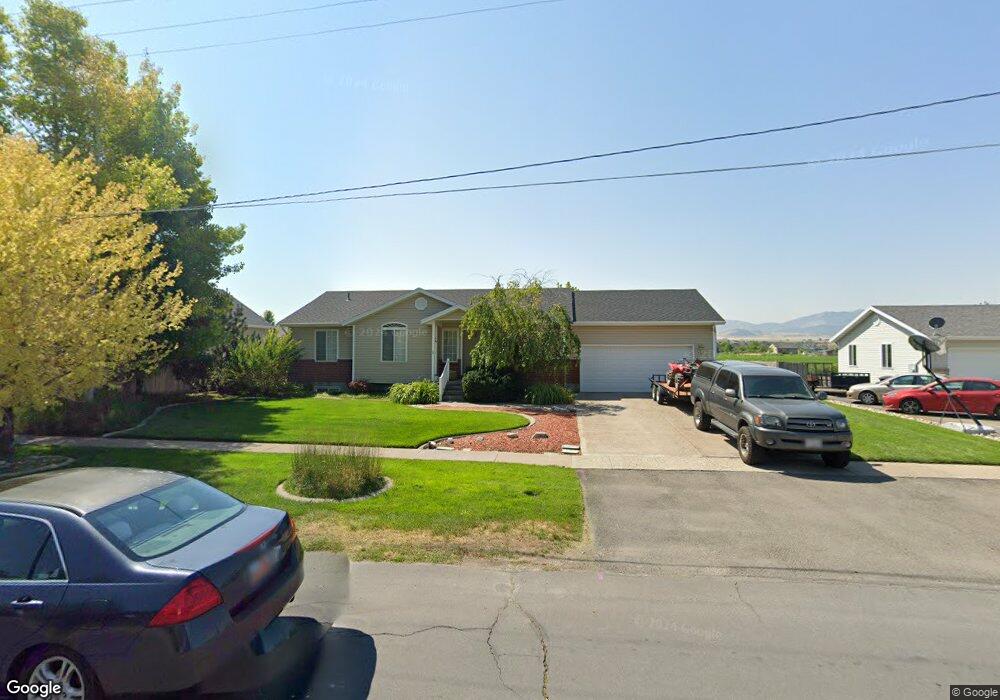
This home is located at 537 W 200 N, Hyrum, UT 84319 and is currently estimated at $483,463, approximately $184 per square foot. 537 W 200 N is a home located in Cache County with nearby schools including Lincoln School, South Cache Middle School, and Mountain Crest High School.
Ownership History
Date
Name
Owned For
Owner Type
Purchase Details
Closed on
Aug 30, 2024
Sold by
Gordon E And Lisa Dixon Family Revocable and Johnson Lisa W
Bought by
Gordon E And Lisa Dixon Family Revocable Trus and Dixon
Current Estimated Value
Purchase Details
Closed on
Feb 8, 2012
Sold by
Morris Carol H
Bought by
Johnson Lisa W
Purchase Details
Closed on
Apr 27, 2009
Sold by
Morris Carol
Bought by
Morris Carol H and Johnson Lisa W
Home Financials for this Owner
Home Financials are based on the most recent Mortgage that was taken out on this home.
Original Mortgage
$157,500
Interest Rate
5.02%
Mortgage Type
New Conventional
Purchase Details
Closed on
Sep 26, 2008
Sold by
Rozanski James D and Rozanski Kathleen J
Bought by
Morris Carol
Home Financials for this Owner
Home Financials are based on the most recent Mortgage that was taken out on this home.
Original Mortgage
$157,500
Interest Rate
6.43%
Mortgage Type
Purchase Money Mortgage
Create a Home Valuation Report for This Property
The Home Valuation Report is an in-depth analysis detailing your home's value as well as a comparison with similar homes in the area
Home Values in the Area
Average Home Value in this Area
Purchase History
| Date | Buyer | Sale Price | Title Company |
|---|---|---|---|
| Gordon E And Lisa Dixon Family Revocable Trus | -- | None Listed On Document | |
| Johnson Lisa W | -- | None Available | |
| Morris Carol H | -- | Hickman Land Title Company | |
| Morris Carol | -- | American Secure Title |
Source: Public Records
Mortgage History
| Date | Status | Borrower | Loan Amount |
|---|---|---|---|
| Previous Owner | Morris Carol H | $157,500 | |
| Previous Owner | Morris Carol | $157,500 |
Source: Public Records
Tax History Compared to Growth
Tax History
| Year | Tax Paid | Tax Assessment Tax Assessment Total Assessment is a certain percentage of the fair market value that is determined by local assessors to be the total taxable value of land and additions on the property. | Land | Improvement |
|---|---|---|---|---|
| 2025 | $1,756 | $252,130 | $0 | $0 |
| 2024 | $1,708 | $228,970 | $0 | $0 |
| 2023 | $1,720 | $220,505 | $0 | $0 |
| 2022 | $1,795 | $220,505 | $0 | $0 |
| 2021 | $1,763 | $333,745 | $65,050 | $268,695 |
| 2020 | $1,532 | $272,130 | $65,050 | $207,080 |
| 2019 | $1,476 | $246,640 | $39,560 | $207,080 |
| 2018 | $1,360 | $219,630 | $39,560 | $180,070 |
| 2017 | $1,334 | $111,795 | $0 | $0 |
| 2016 | $1,364 | $111,795 | $0 | $0 |
| 2015 | $1,226 | $100,240 | $0 | $0 |
| 2014 | $1,197 | $100,075 | $0 | $0 |
| 2013 | -- | $100,075 | $0 | $0 |
Source: Public Records
Map
Nearby Homes
- 535 W 300 N
- 637 W 150 N
- 572 W 300 N
- 28 N 575 W
- 602 W 20 N
- 373 W 300 N
- 661 W 20 N
- 323 N 400 W
- 697 W 20 N
- 670 W 300 N
- 58 N 775 W
- 6 N 400 W
- 325 W 300 N
- 365 W Main St
- Townsend Plan at Lookout Mountain
- Oakfield Plan at Mount Sterling Farms
- Brantwood Plan at Mount Sterling Farms
- Hyland Plan at Lookout Mountain
- Pembroke Plan at Spring Hollow
- Northfield Plan at Mount Sterling Farms