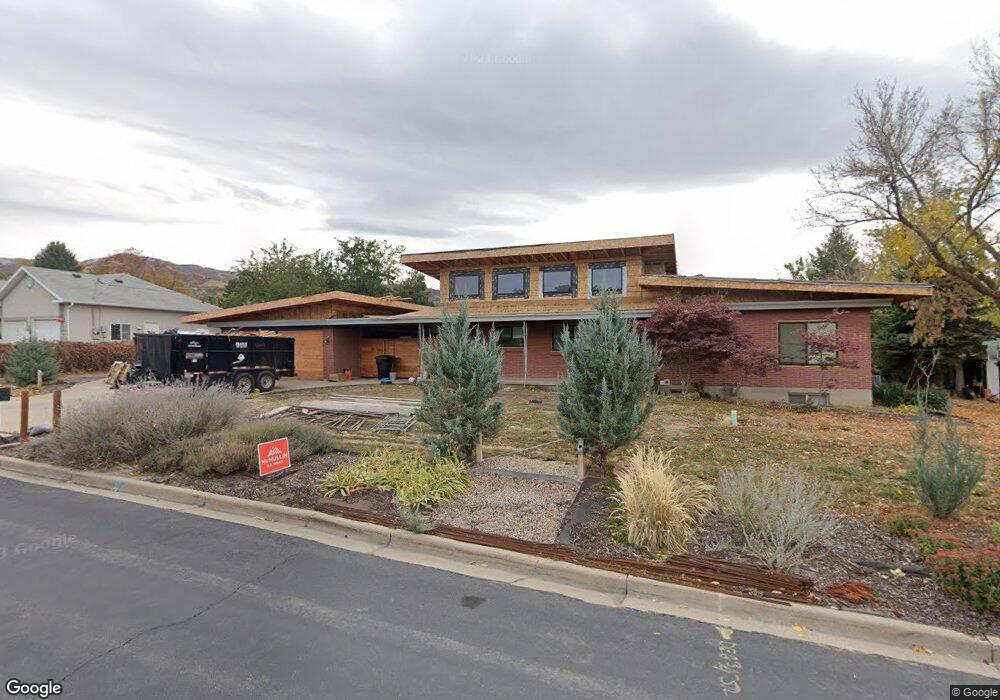
537 W 2900 S Bountiful, UT 84010
Estimated Value: $570,000 - $654,000
5
Beds
2
Baths
2,912
Sq Ft
$212/Sq Ft
Est. Value
About This Home
This home is located at 537 W 2900 S, Bountiful, UT 84010 and is currently estimated at $617,559, approximately $212 per square foot. 537 W 2900 S is a home located in Davis County with nearby schools including Adelaide School, South Davis Junior High School, and Woods Cross High School.
Ownership History
Date
Name
Owned For
Owner Type
Purchase Details
Closed on
Jun 3, 2013
Sold by
Omana Laura B
Bought by
Goodman Rex E and Goodman Jennifer W
Current Estimated Value
Home Financials for this Owner
Home Financials are based on the most recent Mortgage that was taken out on this home.
Original Mortgage
$230,000
Outstanding Balance
$162,246
Interest Rate
3.38%
Mortgage Type
New Conventional
Estimated Equity
$455,313
Purchase Details
Closed on
Oct 30, 2008
Sold by
Omana Tay
Bought by
Omana Laura B
Home Financials for this Owner
Home Financials are based on the most recent Mortgage that was taken out on this home.
Original Mortgage
$177,625
Interest Rate
6.07%
Mortgage Type
Purchase Money Mortgage
Purchase Details
Closed on
May 2, 2002
Sold by
Lewis Horace L and Lewis Shirley E
Bought by
Omana Tay and Omana Laura
Home Financials for this Owner
Home Financials are based on the most recent Mortgage that was taken out on this home.
Original Mortgage
$108,000
Interest Rate
7.13%
Create a Home Valuation Report for This Property
The Home Valuation Report is an in-depth analysis detailing your home's value as well as a comparison with similar homes in the area
Purchase History
| Date | Buyer | Sale Price | Title Company |
|---|---|---|---|
| Goodman Rex E | -- | Advanced Title Ins A | |
| Omana Laura B | -- | Wasatch Title Ins Agency | |
| Omana Tay | -- | First American Title Insuran |
Source: Public Records
Mortgage History
| Date | Status | Borrower | Loan Amount |
|---|---|---|---|
| Open | Goodman Rex E | $230,000 | |
| Previous Owner | Omana Laura B | $177,625 | |
| Previous Owner | Omana Tay | $108,000 |
Source: Public Records
Tax History
| Year | Tax Paid | Tax Assessment Tax Assessment Total Assessment is a certain percentage of the fair market value that is determined by local assessors to be the total taxable value of land and additions on the property. | Land | Improvement |
|---|---|---|---|---|
| 2025 | $3,703 | $311,850 | $204,447 | $107,403 |
| 2024 | $3,357 | $303,050 | $211,120 | $91,930 |
| 2023 | $3,352 | $522,000 | $360,971 | $161,029 |
| 2022 | $3,264 | $283,250 | $190,122 | $93,128 |
| 2021 | $2,933 | $408,000 | $249,910 | $158,090 |
| 2020 | $2,699 | $363,000 | $204,165 | $158,835 |
| 2019 | $2,825 | $366,000 | $161,776 | $204,224 |
| 2018 | $2,475 | $335,000 | $157,521 | $177,479 |
| 2016 | $1,895 | $147,070 | $83,676 | $63,394 |
| 2015 | $1,773 | $134,035 | $83,676 | $50,359 |
| 2014 | $1,596 | $123,392 | $83,676 | $39,716 |
| 2013 | -- | $130,684 | $55,071 | $75,613 |
Source: Public Records
Map
Nearby Homes
- 552 W 2900 S
- 554 W 2900 S
- 544 W 2900 S
- 2749 S 450 W
- 527 Applewood Dr
- 337 W 2900 S
- 404 W 2700 S
- 468 W 3200 S
- 558 Eastpointe Cir
- 3279 Plum Tree Ln
- 678 W 3200 S
- 746 W 3200 S
- 336 W 3500 S
- 304 W 2300 S
- 652 W 3600 S
- 683 Merlin St Unit 4630
- 3285 S Davis Blvd
- 298 Percival St Unit 354
- 785 Percival St
- 2095 S Main St Unit 13
Your Personal Tour Guide
Ask me questions while you tour the home.