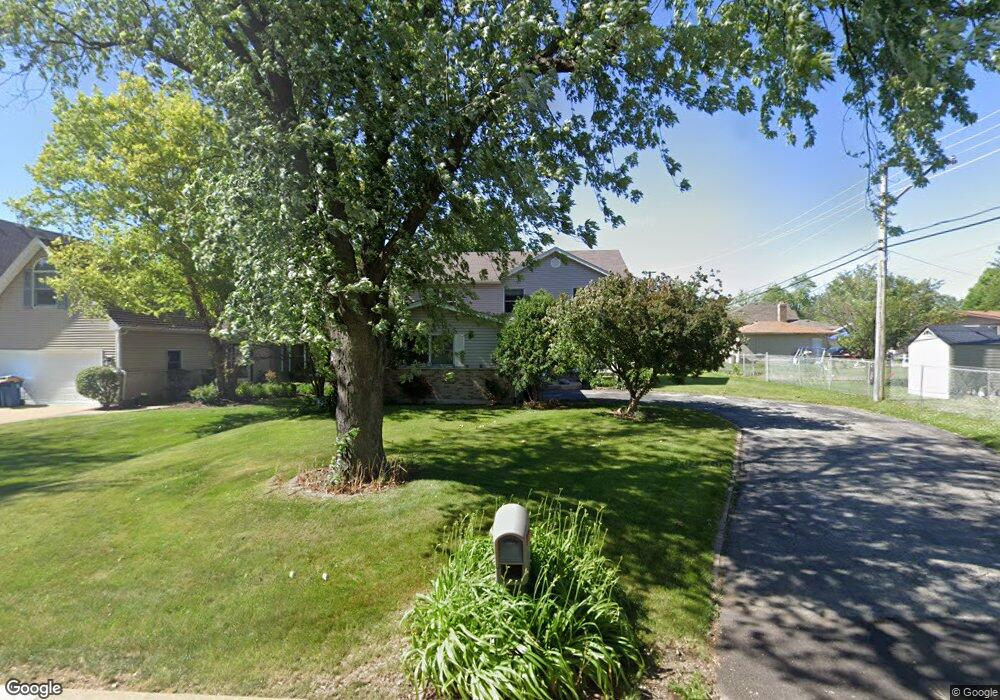
537 W Comstock Ave Elmhurst, IL 60126
Estimated Value: $888,345 - $948,000
Studio
1
Bath
2,784
Sq Ft
$330/Sq Ft
Est. Value
About This Home
This home is located at 537 W Comstock Ave, Elmhurst, IL 60126 and is currently estimated at $919,836, approximately $330 per square foot. 537 W Comstock Ave is a home located in DuPage County with nearby schools including Emerson Elementary School, Churchville Middle School, and York Community High School.
Ownership History
Date
Name
Owned For
Owner Type
Purchase Details
Closed on
May 23, 2000
Sold by
Villa Park Trust & Svgs Bank
Bought by
Freitag Lee and Puente Freitag Cecelia
Current Estimated Value
Home Financials for this Owner
Home Financials are based on the most recent Mortgage that was taken out on this home.
Original Mortgage
$292,000
Outstanding Balance
$101,168
Interest Rate
8.18%
Estimated Equity
$818,668
Create a Home Valuation Report for This Property
The Home Valuation Report is an in-depth analysis detailing your home's value as well as a comparison with similar homes in the area
Home Values in the Area
Average Home Value in this Area
Purchase History
| Date | Buyer | Sale Price | Title Company |
|---|---|---|---|
| Freitag Lee | $365,000 | First American Title Ins |
Source: Public Records
Mortgage History
| Date | Status | Borrower | Loan Amount |
|---|---|---|---|
| Open | Freitag Lee | $292,000 |
Source: Public Records
Tax History
| Year | Tax Paid | Tax Assessment Tax Assessment Total Assessment is a certain percentage of the fair market value that is determined by local assessors to be the total taxable value of land and additions on the property. | Land | Improvement |
|---|---|---|---|---|
| 2024 | $14,827 | $250,107 | $71,501 | $178,606 |
| 2023 | $13,696 | $229,920 | $65,730 | $164,190 |
| 2022 | $13,881 | $232,600 | $62,300 | $170,300 |
| 2021 | $13,297 | $222,790 | $59,670 | $163,120 |
| 2020 | $12,520 | $213,390 | $57,150 | $156,240 |
| 2019 | $12,401 | $205,180 | $54,950 | $150,230 |
| 2018 | $11,759 | $193,750 | $52,340 | $141,410 |
| 2017 | $11,539 | $185,170 | $50,020 | $135,150 |
| 2016 | $11,072 | $170,960 | $46,180 | $124,780 |
| 2015 | $10,873 | $157,930 | $42,660 | $115,270 |
| 2014 | $10,396 | $139,520 | $35,200 | $104,320 |
| 2013 | $10,348 | $142,370 | $35,920 | $106,450 |
Source: Public Records
Map
Nearby Homes
- 526 N West Ave
- 528 West Ave
- 538 N West Ave
- 566 W Comstock Ave
- 568 N West Ave
- 558 N Oaklawn Ave
- 594 W Comstock Ave
- 468 N Highland Ave
- 432 N Ridgeland Ave
- 656 W Comstock Ave
- 655 W Comstock Ave
- 413 N Ridgeland Ave
- 461 W Grantley Ave
- 332 N West Ave
- 330 N Ferndale Ave
- 370 N Oak St
- 367 N Oak St
- 322 N Highland Ave
- 740 N Junior Terrace
- 557 N Myrtle Ave
- 537 W Comstock Ave
- 547 W Comstock Ave
- 544 N West Ave
- 548 N West Ave
- 542 W Gladys Ave
- 538 W Gladys Ave
- 546 W Gladys Ave
- 553 W Comstock Ave
- 554 N West Ave
- 538 W Comstock Ave
- 542 W Comstock Ave
- 546 W Comstock Ave
- 550 W Gladys Ave
- 562 N West Ave
- 550 W Comstock Ave
- 557 W Comstock Ave
- 554 W Gladys Ave
- 554 W Comstock Ave
- 524 N West Ave
- 535 N West Ave
Your Personal Tour Guide
Ask me questions while you tour the home.