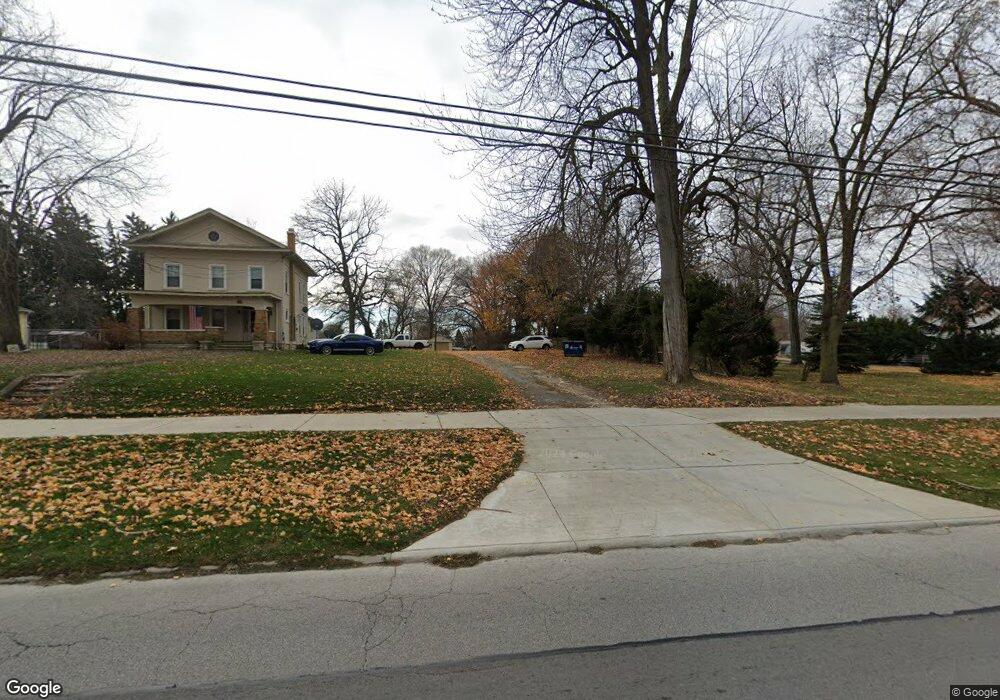
537 W Main St Bellevue, OH 44811
Estimated Value: $132,000 - $235,000
5
Beds
4
Baths
3,160
Sq Ft
$63/Sq Ft
Est. Value
About This Home
This home is located at 537 W Main St, Bellevue, OH 44811 and is currently estimated at $200,000, approximately $63 per square foot. 537 W Main St is a home located in Sandusky County with nearby schools including Bellevue Elementary School, Bellevue Middle School, and Bellevue High School.
Ownership History
Date
Name
Owned For
Owner Type
Purchase Details
Closed on
Mar 3, 2022
Sold by
Shiloh City Llc
Bought by
Transohio Properties Inc
Current Estimated Value
Purchase Details
Closed on
Nov 18, 2019
Sold by
Kemper Kenneth L and Stephen A Kemper Living Trust
Bought by
Shiloh City Llc
Purchase Details
Closed on
Oct 20, 2016
Sold by
Kemper Stephen A
Bought by
Kemper Stephen A and Irons Cheryl A
Purchase Details
Closed on
Dec 29, 2004
Sold by
Kemper Mary Beth
Bought by
Kemper Stephen A
Create a Home Valuation Report for This Property
The Home Valuation Report is an in-depth analysis detailing your home's value as well as a comparison with similar homes in the area
Home Values in the Area
Average Home Value in this Area
Purchase History
| Date | Buyer | Sale Price | Title Company |
|---|---|---|---|
| Transohio Properties Inc | -- | None Listed On Document | |
| Shiloh City Llc | $35,000 | First American | |
| Kemper Stephen A | -- | Attorney | |
| Kemper Stephen A | -- | -- |
Source: Public Records
Tax History Compared to Growth
Tax History
| Year | Tax Paid | Tax Assessment Tax Assessment Total Assessment is a certain percentage of the fair market value that is determined by local assessors to be the total taxable value of land and additions on the property. | Land | Improvement |
|---|---|---|---|---|
| 2024 | $1,448 | $33,010 | $6,300 | $26,710 |
| 2023 | $1,448 | $30,880 | $5,990 | $24,890 |
| 2022 | $1,451 | $30,880 | $5,990 | $24,890 |
| 2021 | $1,462 | $30,880 | $5,990 | $24,890 |
| 2020 | $457 | $9,110 | $5,990 | $3,120 |
| 2019 | $1,666 | $33,640 | $5,990 | $27,650 |
| 2018 | $1,671 | $33,640 | $5,990 | $27,650 |
| 2017 | $1,666 | $33,640 | $5,990 | $27,650 |
| 2016 | $1,612 | $33,640 | $5,990 | $27,650 |
| 2015 | $1,625 | $33,640 | $5,990 | $27,650 |
| 2014 | $1,604 | $31,780 | $5,950 | $25,830 |
| 2013 | $1,601 | $31,780 | $5,950 | $25,830 |
Source: Public Records
Map
Nearby Homes
- 118 Maplewood
- 0 Oakwood Dr
- 230 Highland Ave Unit 106
- 231 Lawrence St
- 408 W Main St
- 0 County Road 308
- 155 Ashford Ave
- 129 Hamilton St
- 720 Kilbourne St
- 803 Del Moy Ave
- 736 Kilbourne St
- 206 Southwest St
- 818 Bellaire Dr
- 1085 W Main St
- 111 Park Ave
- 0 Hartland Dr
- 808 Castalia St
- 138 High St
- 881 Flat Rock Rd
- 221 Smith Ave