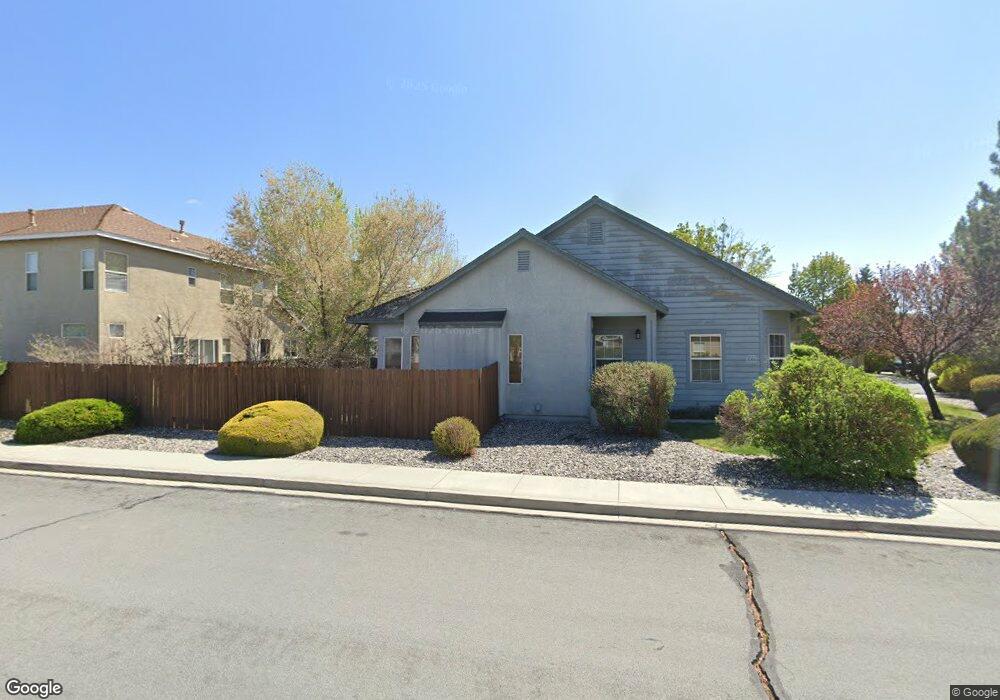
5374 Desert Peach Dr Unit 7 Sparks, NV 89436
Sparks Galleria NeighborhoodEstimated Value: $437,000 - $449,424
3
Beds
2
Baths
1,206
Sq Ft
$367/Sq Ft
Est. Value
About This Home
This home is located at 5374 Desert Peach Dr Unit 7, Sparks, NV 89436 and is currently estimated at $442,356, approximately $366 per square foot. 5374 Desert Peach Dr Unit 7 is a home located in Washoe County with nearby schools including Miguel Sepulveda Elementary School, Sky Ranch Middle School, and Edward C Reed High School.
Ownership History
Date
Name
Owned For
Owner Type
Purchase Details
Closed on
Jun 14, 2011
Sold by
Barca Joseph H
Bought by
Baskerville Walsh Gail
Current Estimated Value
Purchase Details
Closed on
Jun 13, 2006
Sold by
Nakamura Robert C and Nakamura Robert
Bought by
Barca Joseph H
Home Financials for this Owner
Home Financials are based on the most recent Mortgage that was taken out on this home.
Original Mortgage
$80,000
Interest Rate
6.55%
Mortgage Type
Unknown
Purchase Details
Closed on
Dec 1, 2000
Sold by
Sparks Development Llc
Bought by
Nakamura Robert
Home Financials for this Owner
Home Financials are based on the most recent Mortgage that was taken out on this home.
Original Mortgage
$91,500
Interest Rate
7.86%
Create a Home Valuation Report for This Property
The Home Valuation Report is an in-depth analysis detailing your home's value as well as a comparison with similar homes in the area
Home Values in the Area
Average Home Value in this Area
Purchase History
| Date | Buyer | Sale Price | Title Company |
|---|---|---|---|
| Baskerville Walsh Gail | $134,500 | First Centennial | |
| Barca Joseph H | $290,000 | Ticor Title Of Nevada Inc | |
| Nakamura Robert | $150,000 | First American Title |
Source: Public Records
Mortgage History
| Date | Status | Borrower | Loan Amount |
|---|---|---|---|
| Previous Owner | Barca Joseph H | $80,000 | |
| Previous Owner | Nakamura Robert | $91,500 |
Source: Public Records
Tax History Compared to Growth
Tax History
| Year | Tax Paid | Tax Assessment Tax Assessment Total Assessment is a certain percentage of the fair market value that is determined by local assessors to be the total taxable value of land and additions on the property. | Land | Improvement |
|---|---|---|---|---|
| 2025 | $2,285 | $80,815 | $29,260 | $51,555 |
| 2024 | $2,285 | $78,499 | $26,600 | $51,899 |
| 2023 | $2,117 | $76,584 | $27,405 | $49,179 |
| 2022 | $2,816 | $65,158 | $24,115 | $41,043 |
| 2021 | $2,620 | $60,408 | $19,530 | $40,878 |
| 2020 | $2,312 | $60,622 | $19,635 | $40,987 |
| 2019 | $2,412 | $58,275 | $18,655 | $39,620 |
| 2018 | $2,259 | $51,935 | $13,090 | $38,845 |
| 2017 | $3,563 | $51,305 | $12,390 | $38,915 |
| 2016 | $1,467 | $51,736 | $11,165 | $40,571 |
| 2015 | $1,465 | $50,689 | $10,115 | $40,574 |
| 2014 | $1,421 | $47,193 | $8,260 | $38,933 |
| 2013 | -- | $39,617 | $7,105 | $32,512 |
Source: Public Records
Map
Nearby Homes
- 5049 Keams Ct
- 811 Pinchot Pass Ct Unit 5
- 801 Pinchot Pass Ct Unit 7
- 5365 Ebbetts Pass Dr
- 4950 San Diego Ct
- 6835 Summit View Dr
- 2084 Great Bluffs Ln Unit Homesite 5132
- 2094 Great Bluffs Ln Unit Homesite 5133
- 7129 Singing Tree Rd Unit Homesite 5121
- 6671 April St
- 601 W Equinox Peak Ct
- 601 W Equinox Peak Ct Unit Homesite 2030
- 4956 Monrovia Dr
- 6835 Pah Rah Dr
- 1304 Lambrusca Dr
- 1215 Ebling Dr
- 6920 Pah Rah Dr
- 5651 Hunting Creek Way
- 4748 Pradera St
- 6550 Pyramid Way Unit 61
- 5404 Desert Peach Dr
- 5370 Desert Peach Dr
- 5380 Desert Peach Dr
- 5420 Desert Peach Dr
- 5366 Desert Peach Dr
- 913 Ephedra Ln
- 5405 Desert Peach Dr Unit 8
- 5358 Desert Peach Dr Unit 7
- 5401 Desert Peach Dr Unit 7
- 5417 Desert Peach Dr
- 907 Ephedra Ln
- 5389 Desert Peach Dr Unit 7
- 5362 Desert Peach Dr
- 5409 Desert Peach Dr Unit 8
- 5421 Desert Peach Dr
- 919 Ephedra Ln
- 5377 Desert Peach Dr
- 5413 Desert Peach Dr Unit 8
- 5397 Desert Peach Dr
- 5354 Desert Peach Dr