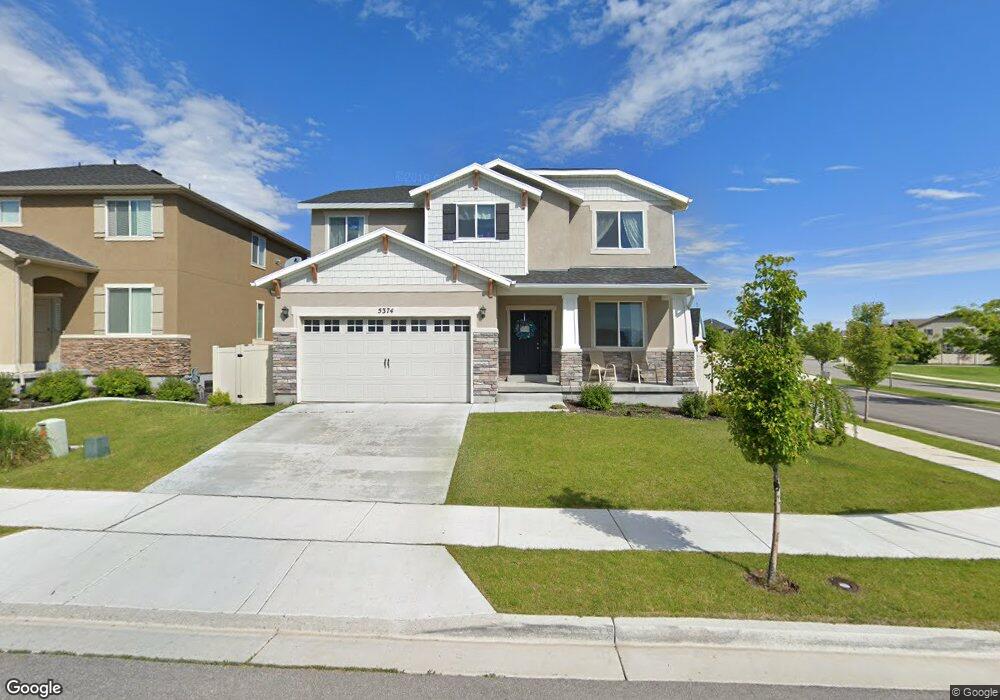
5374 W Moorfield Dr Unit 86 Herriman, UT 84096
Estimated Value: $618,000 - $659,000
4
Beds
3
Baths
3,570
Sq Ft
$179/Sq Ft
Est. Value
About This Home
This home is located at 5374 W Moorfield Dr Unit 86, Herriman, UT 84096 and is currently estimated at $639,908, approximately $179 per square foot. 5374 W Moorfield Dr Unit 86 is a home located in Salt Lake County with nearby schools including Silver Crest School, Copper Mountain Middle School, and Herriman High School.
Ownership History
Date
Name
Owned For
Owner Type
Purchase Details
Closed on
Jun 3, 2015
Sold by
Taylor Brandon
Bought by
Taylor Brandon and Taylor Lacey
Current Estimated Value
Home Financials for this Owner
Home Financials are based on the most recent Mortgage that was taken out on this home.
Original Mortgage
$286,000
Outstanding Balance
$216,769
Interest Rate
3.62%
Mortgage Type
New Conventional
Estimated Equity
$423,139
Purchase Details
Closed on
Mar 11, 2014
Sold by
Mcarthur Homes 07 Lc
Bought by
Taylor Brandon
Home Financials for this Owner
Home Financials are based on the most recent Mortgage that was taken out on this home.
Original Mortgage
$287,888
Interest Rate
4.29%
Mortgage Type
New Conventional
Purchase Details
Closed on
Nov 7, 2013
Sold by
Htc Communities Llc
Bought by
Mcarthur Homes 07 Lc
Home Financials for this Owner
Home Financials are based on the most recent Mortgage that was taken out on this home.
Original Mortgage
$174,000
Interest Rate
4.27%
Mortgage Type
Construction
Create a Home Valuation Report for This Property
The Home Valuation Report is an in-depth analysis detailing your home's value as well as a comparison with similar homes in the area
Home Values in the Area
Average Home Value in this Area
Purchase History
| Date | Buyer | Sale Price | Title Company |
|---|---|---|---|
| Taylor Brandon | -- | Crossland Title Llc | |
| Taylor Brandon | -- | Surety Title | |
| Mcarthur Homes 07 Lc | -- | Metro National Title |
Source: Public Records
Mortgage History
| Date | Status | Borrower | Loan Amount |
|---|---|---|---|
| Open | Taylor Brandon | $286,000 | |
| Closed | Taylor Brandon | $287,888 | |
| Previous Owner | Mcarthur Homes 07 Lc | $174,000 |
Source: Public Records
Tax History Compared to Growth
Tax History
| Year | Tax Paid | Tax Assessment Tax Assessment Total Assessment is a certain percentage of the fair market value that is determined by local assessors to be the total taxable value of land and additions on the property. | Land | Improvement |
|---|---|---|---|---|
| 2025 | $3,567 | $613,200 | $172,900 | $440,300 |
| 2024 | $3,567 | $585,000 | $165,000 | $420,000 |
| 2023 | $3,669 | $569,500 | $137,800 | $431,700 |
| 2022 | $3,767 | $583,000 | $135,100 | $447,900 |
| 2021 | $3,309 | $449,500 | $105,900 | $343,600 |
| 2020 | $2,996 | $383,700 | $105,900 | $277,800 |
| 2019 | $2,918 | $367,400 | $105,900 | $261,500 |
| 2018 | $2,822 | $349,800 | $92,000 | $257,800 |
| 2017 | $2,801 | $343,400 | $92,000 | $251,400 |
| 2016 | $2,651 | $311,800 | $100,700 | $211,100 |
| 2015 | $2,473 | $281,800 | $107,400 | $174,400 |
| 2014 | $1,541 | $172,000 | $94,900 | $77,100 |
Source: Public Records
Map
Nearby Homes
- 13258 S Woodcroft Ln
- 5434 W Pemberton Ln
- 5453 W Anfield Way
- 5352 W Fallowfield Ln
- 13168 S Brickshire Ln
- 5427 W Moorfield Dr
- 5338 W Silver Clover Ln
- 5427 W Aylesbury Dr
- 13132 S Copeland Dr
- 13341 S Copper Park Dr
- 13269 S Meadowside Dr
- 5293 W van Dyne Ln Unit 216
- 5251 W Linley Ct
- 5292 W van Dyne Ln Unit 222
- 5288 W Solafax Ln Unit 34-1
- 5288 W Solafax Ln Unit 34-I
- 5289 W van Dyne Ln
- 13364 S Stone Hayes Ct
- 13377 S Vitasol Ln
- 13061 S Cannavale Dr Unit B101
- 5382 W Moorfield Dr Unit 85
- 5382 W Moorfield Dr
- 13236 S Herriman Rose Blvd
- 5386 W Moorfield Dr
- 13253 S Woodcroft Ln
- 13247 S Woodcroft Ln
- 5369 W Moorfield Dr
- 5373 W Moorfield Dr
- 13228 S Herriman Rose Blvd
- 13241 S Woodcroft Ln
- 5379 W Moorfield Dr
- 13237 S Woodcroft Ln
- 5387 W Moorfield Dr Unit H-82
- 13252 S Woodcroft Ln
- 5398 W Moorfield Dr
- 13218 S Herriman Rose Blvd
- 5334 W Rochdale Ln Unit H-27
- 5334 W Rochdale Ln
- 5391 W Moorfield Dr
- 5344 W Rochdale Ln