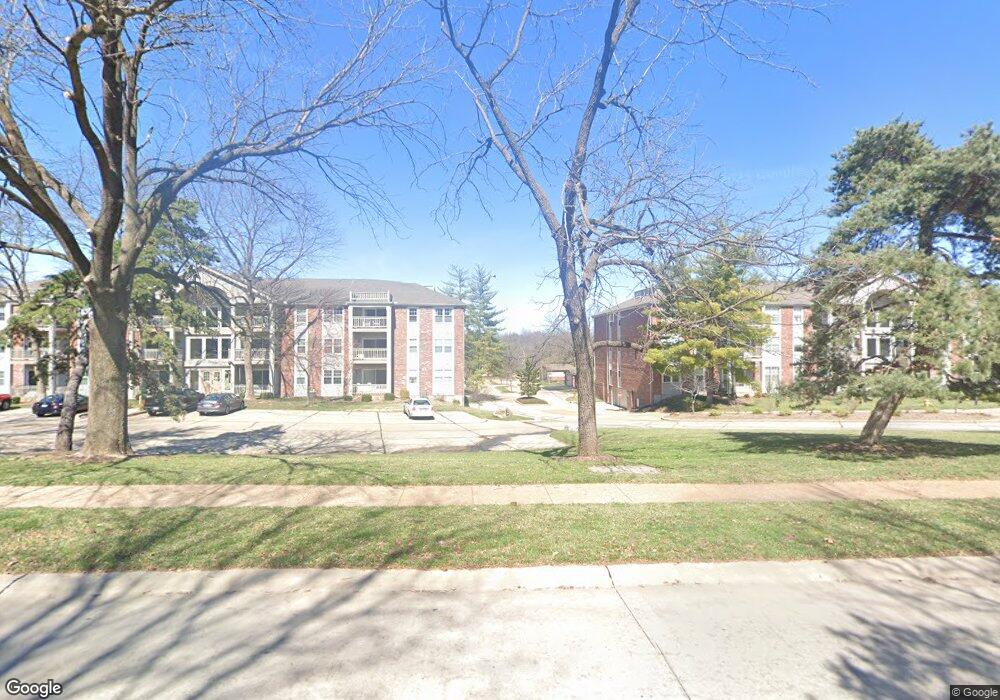
5376 N Kenrick Pk Dr Unit 305 Saint Louis, MO 63119
Estimated Value: $187,000 - $200,292
2
Beds
2
Baths
1,088
Sq Ft
$180/Sq Ft
Est. Value
About This Home
This home is located at 5376 N Kenrick Pk Dr Unit 305, Saint Louis, MO 63119 and is currently estimated at $195,323, approximately $179 per square foot. 5376 N Kenrick Pk Dr Unit 305 is a home located in St. Louis County with nearby schools including Mesnier Primary School, Gotsch Intermediate School, and Rogers Middle School.
Ownership History
Date
Name
Owned For
Owner Type
Purchase Details
Closed on
Nov 8, 2019
Sold by
Aubin Mary Ann and Mccord Revocable Livin Laura R
Bought by
Weilbacher Kathleen S
Current Estimated Value
Purchase Details
Closed on
Jul 3, 2006
Sold by
Mccord Laura R
Bought by
Mccord Laura R and Laura R Mccord Revocable Living Trust
Purchase Details
Closed on
Sep 30, 1999
Sold by
Dougherty Thomas J
Bought by
Mccord Laura R
Home Financials for this Owner
Home Financials are based on the most recent Mortgage that was taken out on this home.
Original Mortgage
$88,400
Interest Rate
8.02%
Purchase Details
Closed on
Oct 8, 1997
Sold by
Klebba Michaeline M
Bought by
Dougherty Thomas J and Dougherty Donna L
Home Financials for this Owner
Home Financials are based on the most recent Mortgage that was taken out on this home.
Original Mortgage
$75,200
Interest Rate
7.3%
Create a Home Valuation Report for This Property
The Home Valuation Report is an in-depth analysis detailing your home's value as well as a comparison with similar homes in the area
Home Values in the Area
Average Home Value in this Area
Purchase History
| Date | Buyer | Sale Price | Title Company |
|---|---|---|---|
| Weilbacher Kathleen S | $130,000 | Investors Title Co Clayton | |
| Mccord Laura R | -- | None Available | |
| Mccord Laura R | $104,000 | -- | |
| Dougherty Thomas J | -- | -- |
Source: Public Records
Mortgage History
| Date | Status | Borrower | Loan Amount |
|---|---|---|---|
| Previous Owner | Mccord Laura R | $88,400 | |
| Previous Owner | Dougherty Thomas J | $75,200 |
Source: Public Records
Tax History Compared to Growth
Tax History
| Year | Tax Paid | Tax Assessment Tax Assessment Total Assessment is a certain percentage of the fair market value that is determined by local assessors to be the total taxable value of land and additions on the property. | Land | Improvement |
|---|---|---|---|---|
| 2025 | $2,339 | $32,770 | $10,960 | $21,810 |
| 2024 | $2,339 | $30,100 | $5,170 | $24,930 |
| 2023 | $2,287 | $30,100 | $5,170 | $24,930 |
| 2022 | $2,166 | $26,070 | $4,540 | $21,530 |
| 2021 | $1,974 | $26,070 | $4,540 | $21,530 |
| 2020 | $2,135 | $25,990 | $5,170 | $20,820 |
| 2019 | $2,195 | $25,990 | $5,170 | $20,820 |
| 2018 | $2,106 | $22,420 | $3,310 | $19,110 |
| 2017 | $2,100 | $22,420 | $3,310 | $19,110 |
| 2016 | $2,167 | $23,880 | $4,140 | $19,740 |
| 2015 | $2,174 | $23,880 | $4,140 | $19,740 |
| 2014 | $1,947 | $21,210 | $1,960 | $19,250 |
Source: Public Records
Map
Nearby Homes
- 7616 Triwoods Dr Unit D
- 5318 N Kenrick Parke Dr
- 5429 Kenrick Parke Dr Unit 2
- 5442 Vicar Ct Unit 4
- 7501 Triwoods Dr Unit J
- 7415 Triwoods Dr Unit C
- 5429 Chapelford Ln
- 737 Landscape Ave
- 726 Landscape Ave
- 717 Yale Ave
- 5111 Lenox Ave
- 7426 Whitehall Colonial Ln
- 7729 Kenridge Ln
- 423 S Old Orchard Ave
- 435 S Old Orchard Ave
- 5015 Lenox Ave
- 431 Landscape Ct
- 7366 Westover Colonial Ln Unit 1901
- 7356 Whitehall Colonial Ln
- 25 Saint Charles Place
- 5376 N Kenrick Pk Dr Unit 302
- 5376 N Kenrick Pk Dr Unit 205
- 5376 N Kenrick Pk Dr Unit 102
- 5376 N Kenrick Pk Dr Unit 104
- 5376 N Kenrick Pk Dr Unit 108
- 5376 N Kenrick Pk Dr Unit 101
- 5376 N Kenrick Pk Dr Unit 202
- 5376 N Kenrick Pk Dr Unit 206
- 5376 N Kenrick Pk Dr Unit 303
- 5376 N Kenrick Pk Dr Unit 306
- 5376 N Kenrick Pk Dr Unit 304
- 5376 N Kenrick Pk Dr Unit 203
- 5376 N Kenrick Pk Dr Unit 103
- 5376 N Kenrick Pk Dr Unit 207
- 5376 N Kenrick Pk Dr Unit 106
- 5376 N Kenrick Pk Dr Unit 308
- 5376 N Kenrick Pk Dr Unit 307
- 5376 N Kenrick Pk Dr Unit 301
- 5376 N Kenrick Pk Dr Unit 208
- 5376 N Kenrick Pk Dr Unit 204