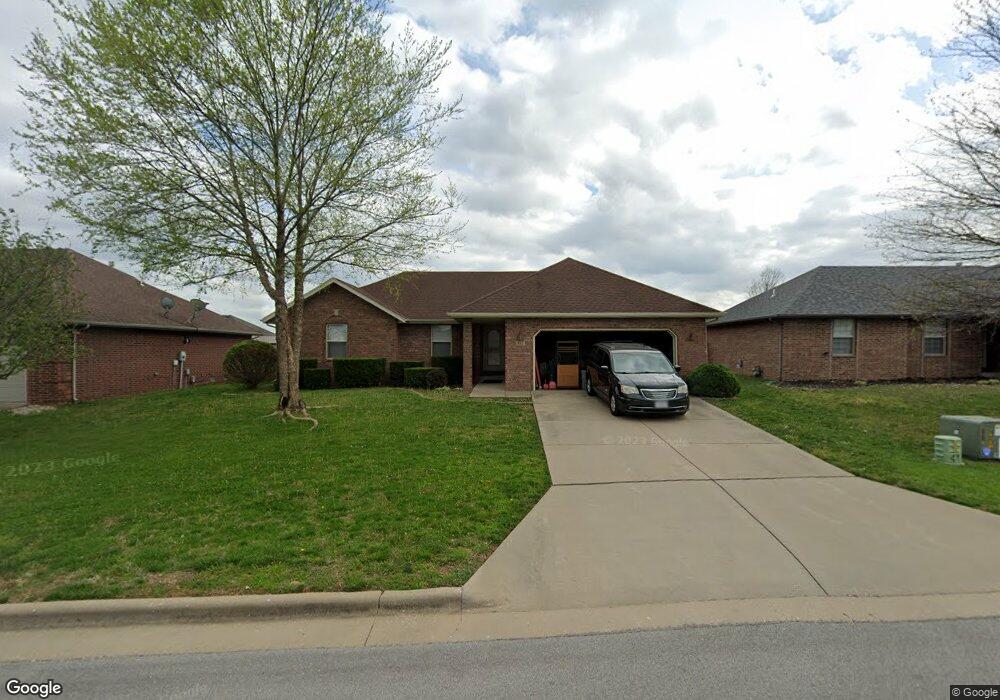
5376 Soapberry Ct Springfield, MO 65802
Estimated Value: $231,000 - $252,000
3
Beds
2
Baths
1,355
Sq Ft
$180/Sq Ft
Est. Value
About This Home
This home is located at 5376 Soapberry Ct, Springfield, MO 65802 and is currently estimated at $244,529, approximately $180 per square foot. 5376 Soapberry Ct is a home located in Greene County with nearby schools including Willard Orchard Hills Elementary School and Willard Intermediate-South.
Ownership History
Date
Name
Owned For
Owner Type
Purchase Details
Closed on
Aug 5, 2021
Sold by
Tre Residential Investments Llc
Bought by
Rendall David
Current Estimated Value
Home Financials for this Owner
Home Financials are based on the most recent Mortgage that was taken out on this home.
Original Mortgage
$174,503
Outstanding Balance
$158,575
Interest Rate
3%
Mortgage Type
New Conventional
Estimated Equity
$85,954
Purchase Details
Closed on
Nov 24, 2009
Sold by
Cox Erika L
Bought by
Morelock Ross Properties Inc
Purchase Details
Closed on
Mar 6, 2007
Sold by
Kemp Carl M and Kemp Carol A
Bought by
Morelock Ross Properties Inc
Home Financials for this Owner
Home Financials are based on the most recent Mortgage that was taken out on this home.
Original Mortgage
$136,900
Interest Rate
6.25%
Mortgage Type
Purchase Money Mortgage
Create a Home Valuation Report for This Property
The Home Valuation Report is an in-depth analysis detailing your home's value as well as a comparison with similar homes in the area
Home Values in the Area
Average Home Value in this Area
Purchase History
| Date | Buyer | Sale Price | Title Company |
|---|---|---|---|
| Rendall David | -- | None Available | |
| Morelock Ross Properties Inc | -- | None Available | |
| Cox Erika L | -- | None Available | |
| Morelock Ross Properties Inc | -- | None Available | |
| Kemp Carl M | -- | None Available |
Source: Public Records
Mortgage History
| Date | Status | Borrower | Loan Amount |
|---|---|---|---|
| Open | Rendall David | $174,503 | |
| Previous Owner | Kemp Carl M | $136,900 |
Source: Public Records
Tax History
| Year | Tax Paid | Tax Assessment Tax Assessment Total Assessment is a certain percentage of the fair market value that is determined by local assessors to be the total taxable value of land and additions on the property. | Land | Improvement |
|---|---|---|---|---|
| 2025 | $2,135 | $37,790 | $8,550 | $29,240 |
| 2024 | $1,878 | $33,500 | $4,750 | $28,750 |
| 2023 | $1,870 | $33,500 | $4,750 | $28,750 |
| 2022 | $1,630 | $28,940 | $4,750 | $24,190 |
| 2021 | $1,631 | $28,940 | $4,750 | $24,190 |
| 2020 | $1,257 | $24,230 | $4,750 | $19,480 |
| 2019 | $1,253 | $24,230 | $4,750 | $19,480 |
| 2018 | $1,220 | $23,480 | $4,750 | $18,730 |
| 2017 | $0 | $22,780 | $4,750 | $18,030 |
| 2016 | $1,168 | $22,780 | $4,750 | $18,030 |
| 2015 | $1,159 | $22,780 | $4,750 | $18,030 |
| 2014 | $1,141 | $22,250 | $4,750 | $17,500 |
Source: Public Records
Map
Nearby Homes
- 5355 Basswood Ct W
- 820 S Quade Rd
- 5163 W Sunstruck St
- 5131 W Sunstruck St
- 5175 W Sunstruck St
- 875 S Natalie Ave
- 5669 W Sunflower Dr
- 795 S Natalie Ave
- 5635 W Mangrove St
- 768 S Long Dr
- 5817 W Alexa Ln
- 5145 W Sunstruck St
- 431 S Bernier Ave
- 4853 Silo Hills Dr
- 5021 W Tarkio St
- 4800 W Mount Vernon St
- 000 W Farm Road 148
- 000 W Independence Dr
- 4905 W Kingsbury St
- 4881 W Washita St
- 5368 Soapberry Ct
- 5384 Soapberry Ct
- 5369 Butternut Dr
- 5377 Butternut Dr
- 5360 Soapberry Ct
- 5385 Butternut Dr
- 5392 Soapberry Ct
- 5375 Soapberry Ct
- 5383 Soapberry Ct
- 5367 Soapberry Ct
- 5361 Butternut Dr
- 5352 Soapberry Ct
- 5391 Soapberry Ct
- 5393 Butternut Dr
- 5359 Soapberry Ct
- 5378 Butternut Dr
- 5370 Butternut Dr
- 5351 Soapberry Ct
- 5362 Butternut Dr
- 5345 Butternut Dr
Your Personal Tour Guide
Ask me questions while you tour the home.