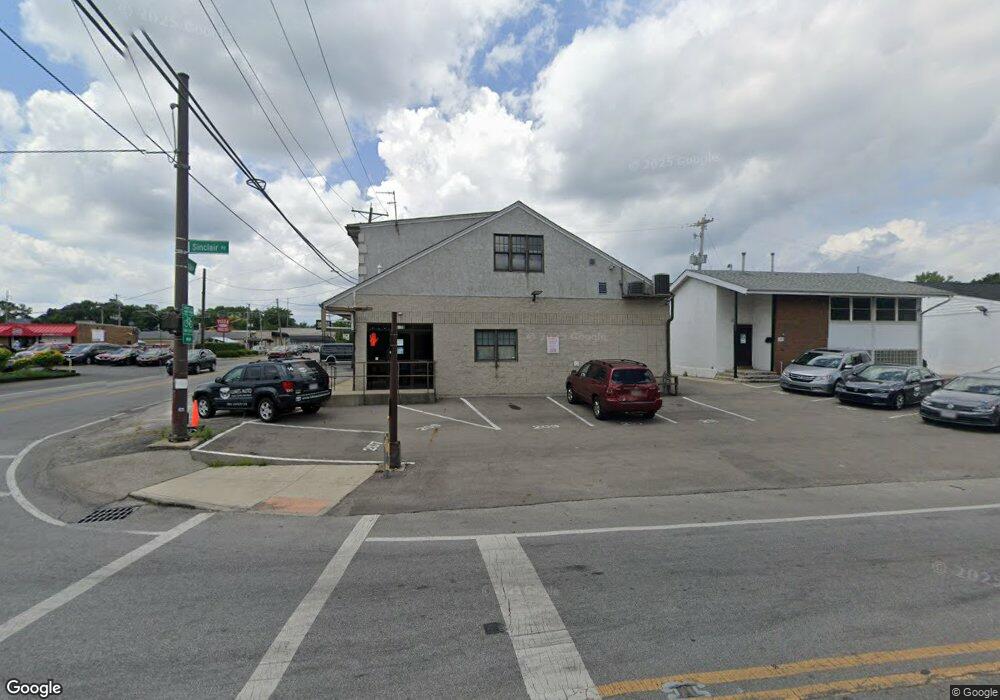
5379 Sinclair Rd Columbus, OH 43229
Salem Village NeighborhoodEstimated Value: $647,903
Studio
--
Bath
3,840
Sq Ft
$169/Sq Ft
Est. Value
About This Home
This home is located at 5379 Sinclair Rd, Columbus, OH 43229 and is currently estimated at $647,903, approximately $168 per square foot. 5379 Sinclair Rd is a home located in Franklin County with nearby schools including Salem Elementary School, Dominion Middle School, and Whetstone High School.
Ownership History
Date
Name
Owned For
Owner Type
Purchase Details
Closed on
Oct 7, 2025
Sold by
3622 Brandon Llc
Bought by
Titus 15 Llc
Current Estimated Value
Home Financials for this Owner
Home Financials are based on the most recent Mortgage that was taken out on this home.
Original Mortgage
$520,000
Outstanding Balance
$520,000
Interest Rate
6.56%
Mortgage Type
Credit Line Revolving
Estimated Equity
$127,903
Purchase Details
Closed on
Nov 7, 2023
Sold by
Paid Grants
Bought by
3622 Brandon Llc
Purchase Details
Closed on
Oct 23, 2023
Sold by
Paid Grants
Bought by
3622 Brandon Llc
Purchase Details
Closed on
Aug 8, 2019
Sold by
Carpenter Arthur and Carpenter Ronda
Bought by
Carpenter S Investment Company Llc
Purchase Details
Closed on
May 21, 2013
Sold by
Price Michael and Estate Of Clyde E Price
Bought by
Carpenter Arthur and Carpenter Ronda
Purchase Details
Closed on
Aug 12, 2002
Sold by
C E Price Door Co Inc
Bought by
Price Clyde E
Purchase Details
Closed on
Apr 5, 2002
Sold by
Wilson Ralph H
Bought by
C E Price Door Co Inc
Purchase Details
Closed on
Apr 27, 1993
Bought by
Wilson Ralph H
Purchase Details
Closed on
Nov 1, 1981
Create a Home Valuation Report for This Property
The Home Valuation Report is an in-depth analysis detailing your home's value as well as a comparison with similar homes in the area
Home Values in the Area
Average Home Value in this Area
Purchase History
| Date | Buyer | Sale Price | Title Company |
|---|---|---|---|
| Titus 15 Llc | $650,000 | Fidelity National Title | |
| 3622 Brandon Llc | -- | None Listed On Document | |
| 3622 Brandon Llc | -- | None Listed On Document | |
| Carpenter S Investment Company Llc | -- | Bridge Title Box | |
| Carpenter Arthur | $190,000 | None Available | |
| Price Clyde E | $96,000 | -- | |
| C E Price Door Co Inc | $96,000 | -- | |
| Wilson Ralph H | $86,000 | -- | |
| -- | $39,400 | -- |
Source: Public Records
Mortgage History
| Date | Status | Borrower | Loan Amount |
|---|---|---|---|
| Open | Titus 15 Llc | $520,000 |
Source: Public Records
Tax History
| Year | Tax Paid | Tax Assessment Tax Assessment Total Assessment is a certain percentage of the fair market value that is determined by local assessors to be the total taxable value of land and additions on the property. | Land | Improvement |
|---|---|---|---|---|
| 2025 | $4,807 | $64,760 | $12,010 | $52,750 |
| 2024 | $4,807 | $64,760 | $12,010 | $52,750 |
| 2023 | $4,731 | $64,760 | $12,010 | $52,750 |
| 2022 | $5,583 | $74,450 | $11,830 | $62,620 |
| 2021 | $5,607 | $74,450 | $11,830 | $62,620 |
| 2020 | $5,569 | $74,450 | $11,830 | $62,620 |
| 2019 | $5,333 | $64,750 | $10,290 | $54,460 |
| 2018 | $7,174 | $64,750 | $10,290 | $54,460 |
| 2017 | $5,327 | $64,750 | $10,290 | $54,460 |
| 2016 | $5,787 | $66,500 | $10,290 | $56,210 |
| 2015 | $9,031 | $66,500 | $10,290 | $56,210 |
| 2014 | $3,533 | $43,750 | $10,290 | $33,460 |
| 2013 | $1,751 | $43,750 | $10,290 | $33,460 |
Source: Public Records
Map
Nearby Homes
- 5364 Stock Rd
- 736 Worthington Forest Place Unit 736
- 734 Worthington Forest Place Unit 734
- 5301 Indianola Ave
- 627 S Selby Blvd
- 940 Minerva Ave
- 952 Minerva Ave
- 587 Kenbrook Dr
- 5318 Eisenhower Rd
- 468 E Lincoln Ave
- 5480 Rockwood Ct Unit R1
- 281 E Selby Blvd
- 5690 Ironwood Ct
- 5795 Foster Ave
- 5733 Satinwood Dr
- 119 E Lincoln Ave
- 601 Morse Rd
- 1469 Sandalwood Place
- 4615 Glenmawr Ave
- 4605 Glenmawr Ave
- 5385 Sinclair Rd
- 0 Sinclair Rd
- 734 E Lincoln Ave
- 790 E Lincoln Ave
- 5346 Sinclair Rd
- 800 E Lincoln Ave
- 749 E Lincoln Ave
- 798 E Lincoln Ave
- 5378 Sinclair Rd
- 809 E Lincoln Ave
- 5384 Sinclair Rd
- 5330 Sinclair Rd
- 806 E Lincoln Ave
- 806 E Lincoln Ave
- 5369 Stock Rd
- 807 E Lincoln Ave
- 5405 Byers Cir E
- 5392 Sinclair Rd
- 5421 Sinclair Rd
- 5324 Sinclair Rd
Your Personal Tour Guide
Ask me questions while you tour the home.