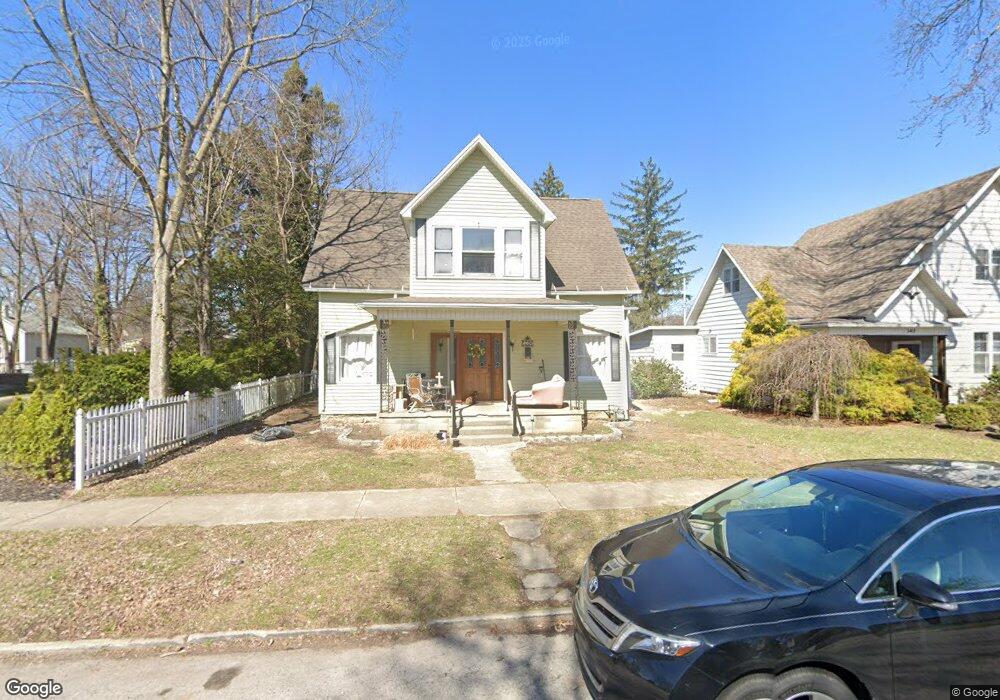
538 Center St Findlay, OH 45840
Estimated Value: $162,000 - $197,000
4
Beds
1
Bath
1,770
Sq Ft
$100/Sq Ft
Est. Value
About This Home
This home is located at 538 Center St, Findlay, OH 45840 and is currently estimated at $176,696, approximately $99 per square foot. 538 Center St is a home located in Hancock County with nearby schools including Whittier Elementary School, Wilson Vance Elementary School, and Donnell Middle School.
Ownership History
Date
Name
Owned For
Owner Type
Purchase Details
Closed on
Sep 16, 2024
Sold by
Wiley Troy M
Bought by
Wiley Troy M and Wiley Dianne
Current Estimated Value
Home Financials for this Owner
Home Financials are based on the most recent Mortgage that was taken out on this home.
Original Mortgage
$128,627
Outstanding Balance
$127,264
Interest Rate
6.78%
Mortgage Type
New Conventional
Estimated Equity
$49,432
Purchase Details
Closed on
Sep 3, 2024
Sold by
Younger Scott
Bought by
Wiley Troy M
Home Financials for this Owner
Home Financials are based on the most recent Mortgage that was taken out on this home.
Original Mortgage
$128,627
Outstanding Balance
$127,264
Interest Rate
6.78%
Mortgage Type
New Conventional
Estimated Equity
$49,432
Purchase Details
Closed on
Aug 10, 2007
Sold by
Fannie Mae
Bought by
Younger Scott
Purchase Details
Closed on
Mar 6, 2007
Sold by
Roberts Florence
Bought by
Fanniemae and Federal National Mortgage Association
Create a Home Valuation Report for This Property
The Home Valuation Report is an in-depth analysis detailing your home's value as well as a comparison with similar homes in the area
Home Values in the Area
Average Home Value in this Area
Purchase History
| Date | Buyer | Sale Price | Title Company |
|---|---|---|---|
| Wiley Troy M | -- | Whitman Title | |
| Wiley Troy M | $131,000 | Whitman Title | |
| Younger Scott | $50,000 | Louisville Title | |
| Fanniemae | $43,334 | Ohio Title Corp |
Source: Public Records
Mortgage History
| Date | Status | Borrower | Loan Amount |
|---|---|---|---|
| Open | Wiley Troy M | $128,627 |
Source: Public Records
Tax History
| Year | Tax Paid | Tax Assessment Tax Assessment Total Assessment is a certain percentage of the fair market value that is determined by local assessors to be the total taxable value of land and additions on the property. | Land | Improvement |
|---|---|---|---|---|
| 2024 | $1,992 | $56,050 | $5,180 | $50,870 |
| 2023 | $2,047 | $56,050 | $5,180 | $50,870 |
| 2022 | $2,039 | $56,050 | $5,180 | $50,870 |
| 2021 | $1,461 | $34,980 | $5,450 | $29,530 |
| 2020 | $1,461 | $34,980 | $5,450 | $29,530 |
| 2019 | $1,432 | $34,980 | $5,450 | $29,530 |
| 2018 | $1,362 | $30,510 | $4,740 | $25,770 |
| 2017 | $1,362 | $30,510 | $4,740 | $25,770 |
| 2016 | $1,351 | $30,510 | $4,740 | $25,770 |
| 2015 | $1,205 | $26,790 | $4,740 | $22,050 |
| 2014 | $1,186 | $26,370 | $4,740 | $21,630 |
| 2012 | $1,071 | $23,630 | $4,740 | $18,890 |
Source: Public Records
Map
Nearby Homes
- 523 Center St
- 640 Center St
- 655 Clinton Ct
- 439 Carnahan Ave
- 626 Central Ave
- 810 Mcconnell St
- 213 Cherry St
- 741 Central Ave
- 1020 Country Club Dr
- 125 Cherry St
- 623 E Sandusky St
- 207 Ash Ave
- 1001 Decker Ave
- 1125 Glen Meadow Dr
- 1108 Glen Meadow Dr
- 309 Huron Rd
- 100 Warrington Ave
- 1308 Greendale Ave
- 1209 Heather Dr
- 716 Winfield Ave
Your Personal Tour Guide
Ask me questions while you tour the home.