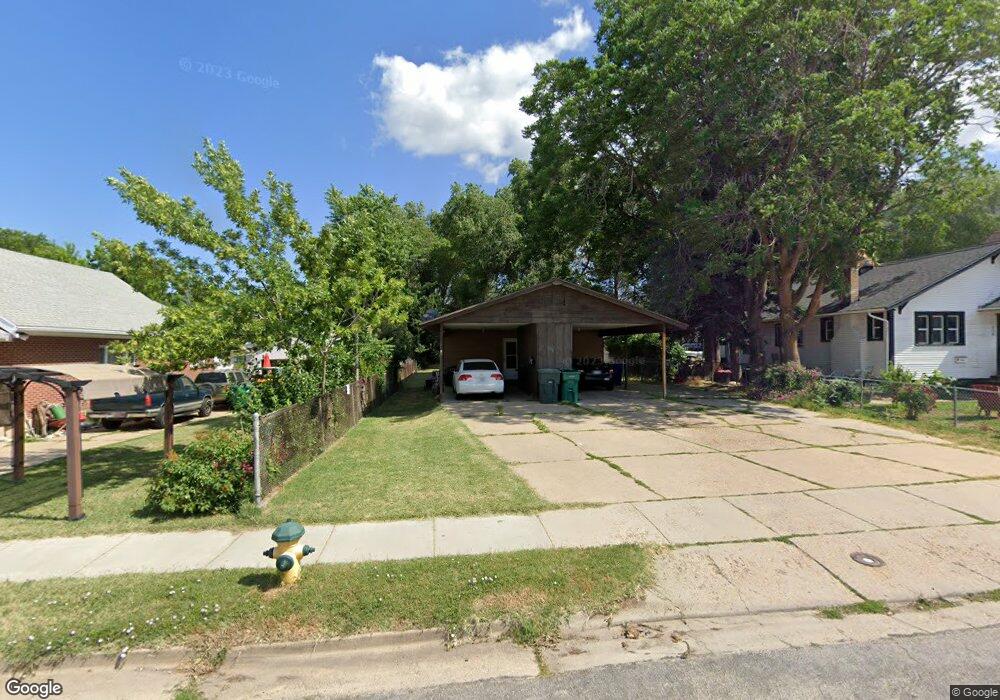
538 Cross St Ogden, UT 84404
Hillcrest-Bonneville NeighborhoodEstimated Value: $467,206 - $521,000
6
Beds
6
Baths
3,328
Sq Ft
$150/Sq Ft
Est. Value
About This Home
This home is located at 538 Cross St, Ogden, UT 84404 and is currently estimated at $499,302, approximately $150 per square foot. 538 Cross St is a home located in Weber County with nearby schools including Bonneville School, Highland Junior High School, and Ben Lomond High School.
Ownership History
Date
Name
Owned For
Owner Type
Purchase Details
Closed on
Dec 2, 2021
Sold by
Cedeno Cesar T and Cedeno Diana T
Bought by
Cedeno Cesar
Current Estimated Value
Home Financials for this Owner
Home Financials are based on the most recent Mortgage that was taken out on this home.
Original Mortgage
$318,000
Outstanding Balance
$291,795
Interest Rate
3.09%
Mortgage Type
New Conventional
Estimated Equity
$207,507
Purchase Details
Closed on
Jul 5, 2019
Sold by
Castaneda Cesar Cedeno and Cedeno Diana T
Bought by
Cedeno Cesar and Cedeno Diana T
Home Financials for this Owner
Home Financials are based on the most recent Mortgage that was taken out on this home.
Original Mortgage
$232,498
Interest Rate
3.75%
Mortgage Type
FHA
Purchase Details
Closed on
Aug 26, 2013
Sold by
Shupe Gerald L and Shupe Delores A
Bought by
Shupe Gerald L and Shupe Delores A
Create a Home Valuation Report for This Property
The Home Valuation Report is an in-depth analysis detailing your home's value as well as a comparison with similar homes in the area
Home Values in the Area
Average Home Value in this Area
Purchase History
| Date | Buyer | Sale Price | Title Company |
|---|---|---|---|
| Cedeno Cesar | -- | Old Republic Title | |
| Cedeno Cesar | -- | Metro National Title | |
| Shupe Gerald L | -- | None Available |
Source: Public Records
Mortgage History
| Date | Status | Borrower | Loan Amount |
|---|---|---|---|
| Open | Cedeno Cesar | $318,000 | |
| Previous Owner | Cedeno Cesar | $232,498 |
Source: Public Records
Tax History
| Year | Tax Paid | Tax Assessment Tax Assessment Total Assessment is a certain percentage of the fair market value that is determined by local assessors to be the total taxable value of land and additions on the property. | Land | Improvement |
|---|---|---|---|---|
| 2025 | $3,259 | $262,776 | $55,000 | $207,776 |
| 2024 | $3,230 | $255,750 | $55,000 | $200,750 |
| 2023 | $3,085 | $245,850 | $40,700 | $205,150 |
| 2022 | $3,029 | $242,000 | $27,500 | $214,500 |
| 2021 | $2,489 | $330,000 | $50,000 | $280,000 |
| 2020 | $2,245 | $275,000 | $43,836 | $231,164 |
| 2019 | $2,078 | $239,000 | $33,491 | $205,509 |
| 2018 | $1,908 | $218,000 | $30,314 | $187,686 |
| 2017 | $1,631 | $174,116 | $29,882 | $144,234 |
| 2016 | $1,564 | $90,263 | $12,650 | $77,613 |
| 2015 | $1,407 | $79,210 | $12,650 | $66,560 |
| 2014 | $1,450 | $80,174 | $11,000 | $69,174 |
Source: Public Records
Map
Nearby Homes
- 545 Chester St
- 968 S Jefferson Ave
- 626 Chester St
- 1107 Jefferson Ave
- 1110 Jefferson Ave
- 718 9th St
- 621 7th St
- 1116 Liberty Ave
- 719 S 350 E Unit 3
- 630 S Plum Creek Ln E
- 360 13th St
- 506 14th St
- 344 13th St
- 1413 S Jefferson Ave
- 876 E 1025 S Unit 49
- 1324 Liberty Ave
- 443 E 1415 S Unit 118
- 439 E 1415 S Unit 117
- 433 E 1415 S Unit 116
- 1424 Jefferson Ave
Your Personal Tour Guide
Ask me questions while you tour the home.