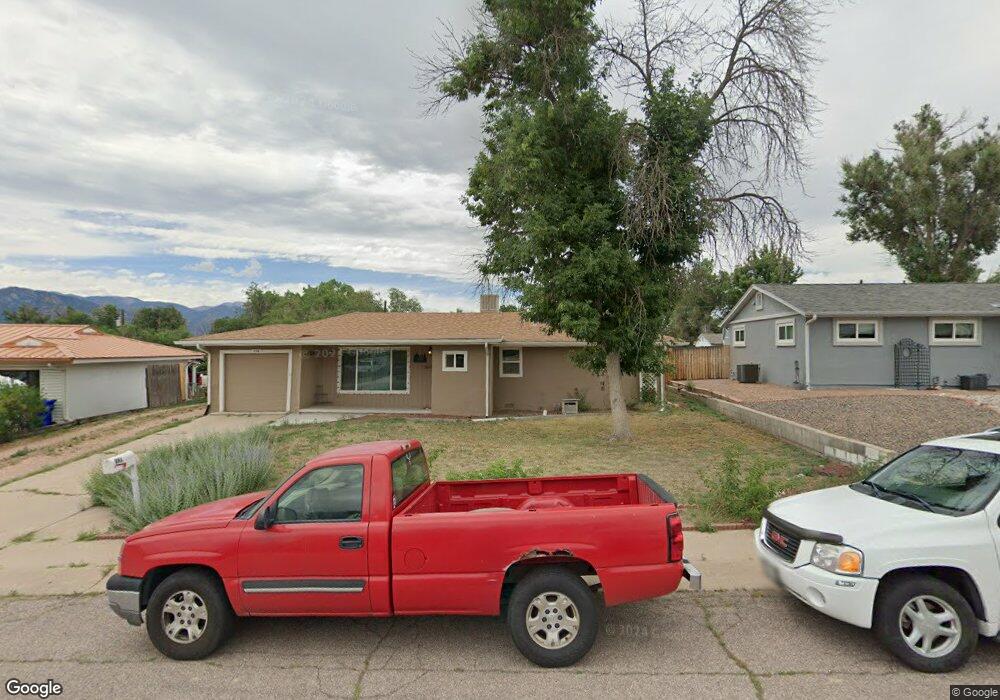
538 Cypress Dr Colorado Springs, CO 80911
Fountain Valley Ranch NeighborhoodEstimated Value: $325,000 - $367,000
3
Beds
1
Bath
1,169
Sq Ft
$300/Sq Ft
Est. Value
About This Home
This home is located at 538 Cypress Dr, Colorado Springs, CO 80911 and is currently estimated at $350,162, approximately $299 per square foot. 538 Cypress Dr is a home located in El Paso County with nearby schools including Widefield Elementary School, Watson Junior High School, and Widefield High School.
Ownership History
Date
Name
Owned For
Owner Type
Purchase Details
Closed on
Jan 10, 2020
Sold by
Cypress Trust
Bought by
Ediger Tyler B
Current Estimated Value
Home Financials for this Owner
Home Financials are based on the most recent Mortgage that was taken out on this home.
Original Mortgage
$255,290
Outstanding Balance
$225,646
Interest Rate
3.62%
Mortgage Type
FHA
Estimated Equity
$124,516
Purchase Details
Closed on
Aug 23, 2019
Sold by
Nurv Ltd
Bought by
Cypress Trust
Home Financials for this Owner
Home Financials are based on the most recent Mortgage that was taken out on this home.
Original Mortgage
$134,400
Interest Rate
3.7%
Mortgage Type
Commercial
Purchase Details
Closed on
Dec 4, 1990
Bought by
Chmielewski Thomas M and Chmielewski Clara D
Purchase Details
Closed on
Feb 1, 1977
Bought by
Chmielewski Thomas M and Chmielewski Clara D
Create a Home Valuation Report for This Property
The Home Valuation Report is an in-depth analysis detailing your home's value as well as a comparison with similar homes in the area
Home Values in the Area
Average Home Value in this Area
Purchase History
| Date | Buyer | Sale Price | Title Company |
|---|---|---|---|
| Ediger Tyler B | $260,000 | None Available | |
| Cypress Trust | $168,000 | Meridian Title Co | |
| Nurv Ltd | $130,000 | Assured Title Agency | |
| Chmielewski Thomas M | $52,900 | -- | |
| Chmielewski Thomas M | -- | -- |
Source: Public Records
Mortgage History
| Date | Status | Borrower | Loan Amount |
|---|---|---|---|
| Open | Ediger Tyler B | $255,290 | |
| Previous Owner | Cypress Trust | $134,400 |
Source: Public Records
Tax History Compared to Growth
Tax History
| Year | Tax Paid | Tax Assessment Tax Assessment Total Assessment is a certain percentage of the fair market value that is determined by local assessors to be the total taxable value of land and additions on the property. | Land | Improvement |
|---|---|---|---|---|
| 2025 | $1,602 | $25,350 | -- | -- |
| 2024 | $1,543 | $25,310 | $4,020 | $21,290 |
| 2023 | $1,543 | $25,310 | $4,020 | $21,290 |
| 2022 | $1,298 | $17,380 | $2,780 | $14,600 |
| 2021 | $1,399 | $17,880 | $2,860 | $15,020 |
| 2020 | $988 | $12,270 | $2,500 | $9,770 |
| 2019 | $983 | $12,270 | $2,500 | $9,770 |
| 2018 | $877 | $10,220 | $1,870 | $8,350 |
| 2017 | $887 | $10,220 | $1,870 | $8,350 |
| 2016 | $728 | $10,240 | $1,990 | $8,250 |
| 2015 | $746 | $10,240 | $1,990 | $8,250 |
| 2014 | $658 | $9,060 | $1,790 | $7,270 |
Source: Public Records
Map
Nearby Homes
- 546 Rosemont Dr
- 601 Hackberry Dr
- 534 Marquette Dr
- 324 Morningside Dr
- 518 Aspen Dr
- 304 Morningside Dr
- 402 Grand Blvd
- 425 Security Blvd
- 197 Norman Dr
- 426 Security Blvd
- 490 Dix Cir
- 173 Norman Dr
- 576 Lindstrom Dr
- 265 Wallace St
- 89 Susanne Cir
- 4980 Wilkin Dr
- 520 Pucket Cir
- 5795 Southmoor Dr Unit 17
- 5795 Southmoor Dr Unit 39
- 4939 Gibbon St
- 534 Cypress Dr
- 542 Cypress Dr
- 522 Rosemont Dr
- 546 Cypress Dr
- 529 Ponderosa Dr
- 533 Ponderosa Dr
- 526 Rosemont Dr
- 533 Cypress Dr
- 529 Cypress Dr
- 530 Rosemont Dr
- 525 Ponderosa Dr
- 537 Cypress Dr
- 526 Cypress Dr
- 537 Ponderosa Dr
- 525 Cypress Dr
- 508 Rosemont Dr
- 521 Ponderosa Dr
- 534 Rosemont Dr
- 521 Cypress Dr
- 541 Ponderosa Dr