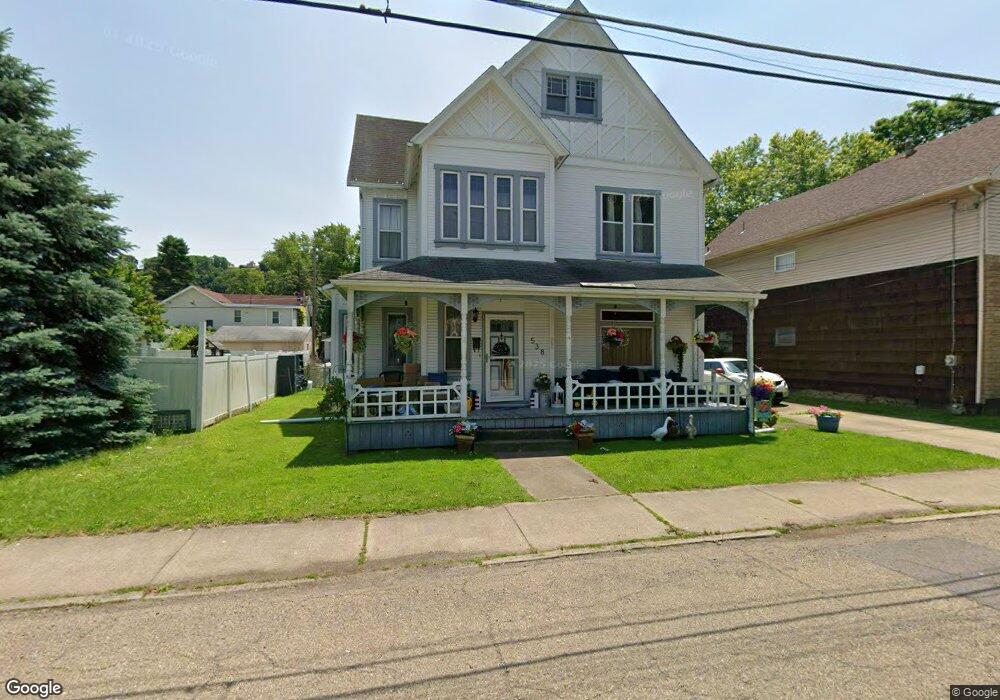
538 E 2nd Ave Tarentum, PA 15084
Estimated Value: $75,000 - $95,882
4
Beds
2
Baths
2,440
Sq Ft
$35/Sq Ft
Est. Value
About This Home
This home is located at 538 E 2nd Ave, Tarentum, PA 15084 and is currently estimated at $85,471, approximately $35 per square foot. 538 E 2nd Ave is a home located in Allegheny County with nearby schools including Highlands Senior High School, Mary Queen of Apostles School, and St. Joseph High School.
Ownership History
Date
Name
Owned For
Owner Type
Purchase Details
Closed on
Jan 2, 2025
Sold by
Fink Kay A
Bought by
Pelican Megan R
Current Estimated Value
Home Financials for this Owner
Home Financials are based on the most recent Mortgage that was taken out on this home.
Original Mortgage
$56,000
Outstanding Balance
$55,611
Interest Rate
6.81%
Mortgage Type
New Conventional
Estimated Equity
$29,860
Purchase Details
Closed on
Nov 29, 2023
Sold by
Fink Edward M Est and Fink Kay A
Bought by
Fink Kay A
Purchase Details
Closed on
Nov 16, 2023
Sold by
Fink Edward M
Bought by
Fink Kay A
Create a Home Valuation Report for This Property
The Home Valuation Report is an in-depth analysis detailing your home's value as well as a comparison with similar homes in the area
Home Values in the Area
Average Home Value in this Area
Purchase History
| Date | Buyer | Sale Price | Title Company |
|---|---|---|---|
| Pelican Megan R | $70,000 | -- | |
| Pelican Megan R | $70,000 | -- | |
| Fink Kay A | $1 | -- | |
| Fink Kay A | -- | -- | |
| Fink Kay A | -- | -- |
Source: Public Records
Mortgage History
| Date | Status | Borrower | Loan Amount |
|---|---|---|---|
| Open | Pelican Megan R | $56,000 | |
| Closed | Pelican Megan R | $56,000 |
Source: Public Records
Tax History
| Year | Tax Paid | Tax Assessment Tax Assessment Total Assessment is a certain percentage of the fair market value that is determined by local assessors to be the total taxable value of land and additions on the property. | Land | Improvement |
|---|---|---|---|---|
| 2025 | $1,650 | $46,700 | $10,200 | $36,500 |
| 2024 | $1,650 | $46,700 | $10,200 | $36,500 |
| 2023 | $1,014 | $28,700 | $10,200 | $18,500 |
| 2022 | $1,007 | $28,700 | $10,200 | $18,500 |
| 2021 | $1,007 | $28,700 | $10,200 | $18,500 |
| 2020 | $1,007 | $28,700 | $10,200 | $18,500 |
| 2019 | $1,000 | $28,700 | $10,200 | $18,500 |
| 2017 | $976 | $28,700 | $10,200 | $18,500 |
Source: Public Records
Map
Nearby Homes
- 511 E 2nd Ave
- 522 E 3rd Ave
- 500 E 2nd Ave
- 426 E 2nd Ave
- 623 E 3rd Ave
- 701 E 2nd Ave
- 726 7th Ave
- 605 E 9th Ave
- 802 Horner St
- 524 Roup St
- 211 E 7th Ave
- 313 E 9th Ave
- 920 Brackenridge Ave
- 103 E 1st Ave
- 343 E 11th Ave
- 1010 Brackenridge Ave
- 721 Morgan St
- 270 Kentucky Dr
- 233 Reed St
- 1054-1056 Cleveland Ave
Your Personal Tour Guide
Ask me questions while you tour the home.