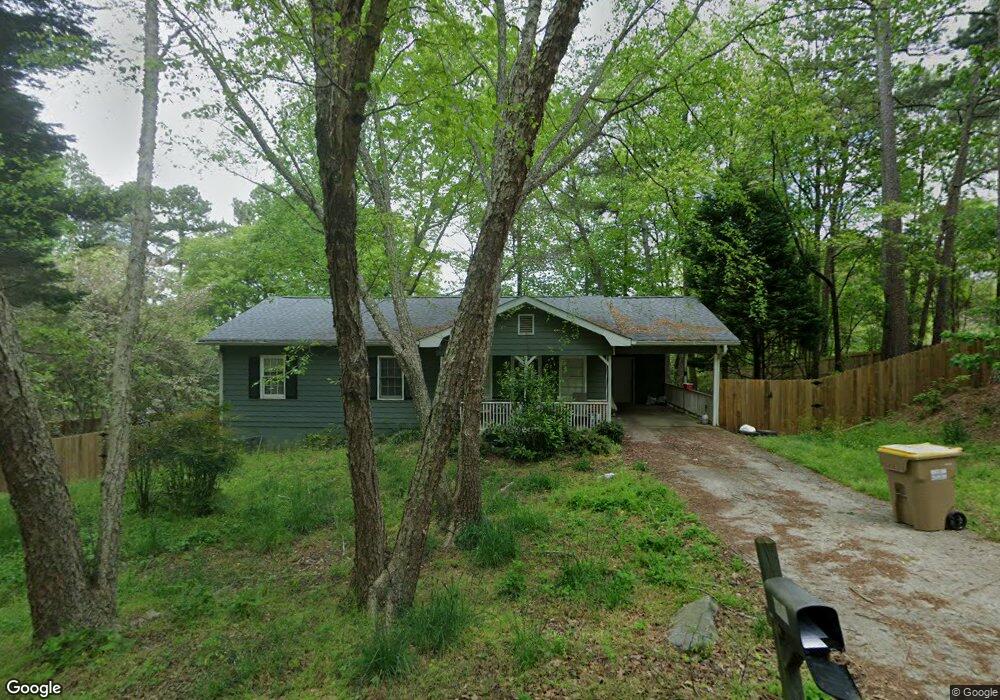
538 Hiram Way Winder, GA 30680
Estimated Value: $253,111 - $295,000
3
Beds
3
Baths
1,179
Sq Ft
$231/Sq Ft
Est. Value
About This Home
This home is located at 538 Hiram Way, Winder, GA 30680 and is currently estimated at $272,028, approximately $230 per square foot. 538 Hiram Way is a home located in Barrow County with nearby schools including Kennedy Elementary School, Westside Middle School, and Apalachee High School.
Ownership History
Date
Name
Owned For
Owner Type
Purchase Details
Closed on
Jul 21, 2020
Sold by
Chandler Devera M
Bought by
Robinson Kristen Reed
Current Estimated Value
Home Financials for this Owner
Home Financials are based on the most recent Mortgage that was taken out on this home.
Original Mortgage
$146,122
Outstanding Balance
$129,571
Interest Rate
3.1%
Mortgage Type
New Conventional
Estimated Equity
$142,457
Purchase Details
Closed on
Sep 20, 2002
Sold by
Robinson Kristen R
Bought by
Robinson Devera M
Purchase Details
Closed on
Nov 1, 1997
Sold by
Sams Deborah E
Bought by
Robinson Devera M and Robinson Kristen R
Purchase Details
Closed on
Oct 23, 1997
Sold by
Reidling Imogene A A
Bought by
Sams Deborah E
Purchase Details
Closed on
Apr 19, 1994
Bought by
Reidling Imogene A A
Purchase Details
Closed on
Mar 1, 1990
Bought by
Reidling Imogene A
Create a Home Valuation Report for This Property
The Home Valuation Report is an in-depth analysis detailing your home's value as well as a comparison with similar homes in the area
Home Values in the Area
Average Home Value in this Area
Purchase History
| Date | Buyer | Sale Price | Title Company |
|---|---|---|---|
| Robinson Kristen Reed | $145,000 | -- | |
| Robinson Devera M | -- | -- | |
| Robinson Devera M | $74,000 | -- | |
| Robinson Devera M An | $74,000 | -- | |
| Sams Deborah E | -- | -- | |
| Reidling Imogene A A | -- | -- | |
| Reidling Imogene A | $63,500 | -- |
Source: Public Records
Mortgage History
| Date | Status | Borrower | Loan Amount |
|---|---|---|---|
| Open | Robinson Kristen Reed | $146,122 | |
| Closed | Robinson Devera M An | -- |
Source: Public Records
Tax History Compared to Growth
Tax History
| Year | Tax Paid | Tax Assessment Tax Assessment Total Assessment is a certain percentage of the fair market value that is determined by local assessors to be the total taxable value of land and additions on the property. | Land | Improvement |
|---|---|---|---|---|
| 2024 | $1,665 | $66,826 | $14,800 | $52,026 |
| 2023 | $1,661 | $67,026 | $14,800 | $52,226 |
| 2022 | $1,671 | $58,016 | $14,800 | $43,216 |
| 2021 | $1,656 | $54,416 | $11,200 | $43,216 |
| 2020 | $1,183 | $44,425 | $11,200 | $33,225 |
| 2019 | $1,174 | $43,286 | $11,200 | $32,086 |
| 2018 | $956 | $34,854 | $9,600 | $25,254 |
| 2017 | $839 | $28,809 | $9,600 | $19,209 |
| 2016 | $658 | $25,552 | $7,000 | $18,552 |
| 2015 | $668 | $25,800 | $7,000 | $18,800 |
| 2014 | -- | $24,438 | $5,390 | $19,048 |
| 2013 | -- | $23,810 | $5,390 | $18,420 |
Source: Public Records
Map
Nearby Homes
- 1498 Box Cir
- 536 Hiram Way
- 1502 Box Cir Unit 99A
- 1502 Box Cir
- 474 Valley Trace
- 1494 Box Cir Unit 102A
- 1494 Box Cir
- 1494 Box Cir Unit 1494
- 1496 Box Cir Unit 101A
- 1496 Box Cir
- 1506 Box Cir Unit 97A
- 1506 Box Cir
- 1504 Box Cir Unit 1504
- 1504 Box Cir Unit 98A
- 1504 Box Cir
- 1504 Box Cir Unit 2
- 472 Valley Trace
- 1508 Box Cir Unit 96A
- 1508 Box Cir
- 1508 Box Cir Unit N/A