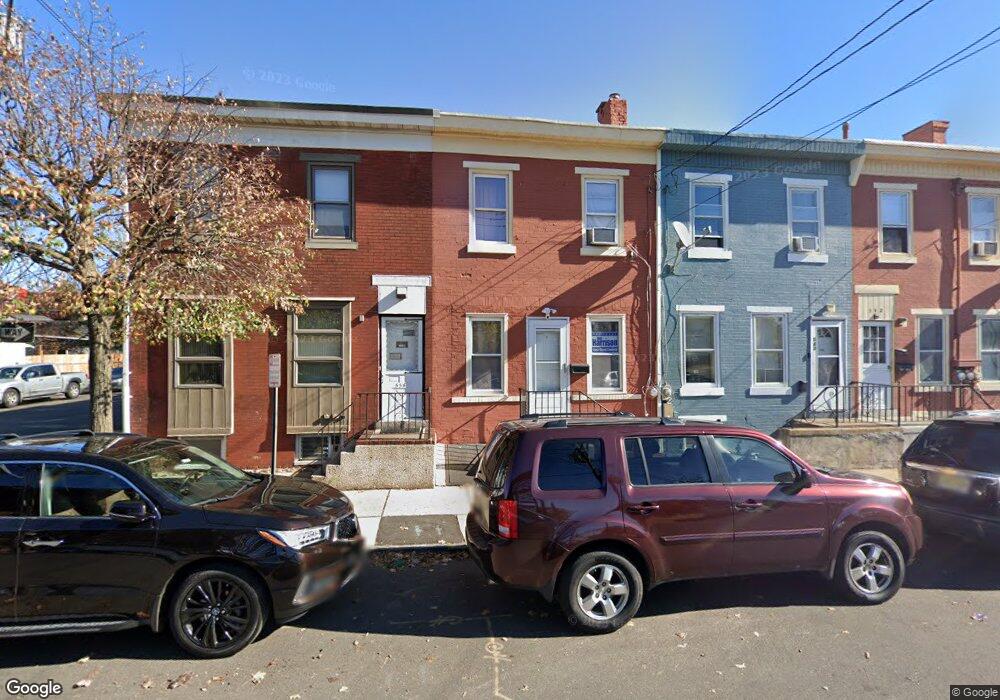
538 Hudson St Trenton, NJ 08611
Chambersburg NeighborhoodEstimated Value: $146,574 - $217,000
--
Bed
--
Bath
1,428
Sq Ft
$135/Sq Ft
Est. Value
About This Home
This home is located at 538 Hudson St, Trenton, NJ 08611 and is currently estimated at $192,644, approximately $134 per square foot. 538 Hudson St is a home located in Mercer County with nearby schools including Robbins Elementary School, Monument Elementary School, and Grace A Dunn Middle School.
Ownership History
Date
Name
Owned For
Owner Type
Purchase Details
Closed on
Jan 13, 2020
Sold by
Tatum Regina Chintti
Bought by
Tatum Philip Andrew
Current Estimated Value
Purchase Details
Closed on
Nov 5, 2004
Sold by
Negron Roberto
Bought by
Tatum Regina
Home Financials for this Owner
Home Financials are based on the most recent Mortgage that was taken out on this home.
Original Mortgage
$76,700
Outstanding Balance
$38,097
Interest Rate
5.71%
Estimated Equity
$154,547
Create a Home Valuation Report for This Property
The Home Valuation Report is an in-depth analysis detailing your home's value as well as a comparison with similar homes in the area
Home Values in the Area
Average Home Value in this Area
Purchase History
| Date | Buyer | Sale Price | Title Company |
|---|---|---|---|
| Tatum Philip Andrew | -- | None Available | |
| Tatum Regina | $80,800 | -- |
Source: Public Records
Mortgage History
| Date | Status | Borrower | Loan Amount |
|---|---|---|---|
| Open | Tatum Regina | $76,700 |
Source: Public Records
Tax History Compared to Growth
Tax History
| Year | Tax Paid | Tax Assessment Tax Assessment Total Assessment is a certain percentage of the fair market value that is determined by local assessors to be the total taxable value of land and additions on the property. | Land | Improvement |
|---|---|---|---|---|
| 2025 | $2,912 | $50,200 | $8,900 | $41,300 |
| 2024 | $2,795 | $50,200 | $8,900 | $41,300 |
| 2023 | $2,795 | $50,200 | $8,900 | $41,300 |
| 2022 | $2,740 | $50,200 | $8,900 | $41,300 |
| 2021 | $2,788 | $50,200 | $8,900 | $41,300 |
| 2020 | $2,779 | $50,200 | $8,900 | $41,300 |
| 2019 | $2,734 | $50,200 | $8,900 | $41,300 |
| 2018 | $2,617 | $50,200 | $8,900 | $41,300 |
| 2017 | $2,487 | $50,200 | $8,900 | $41,300 |
| 2016 | $3,147 | $54,700 | $17,600 | $37,100 |
| 2015 | $3,136 | $54,700 | $17,600 | $37,100 |
| 2014 | $3,121 | $54,700 | $17,600 | $37,100 |
Source: Public Records
Map
Nearby Homes