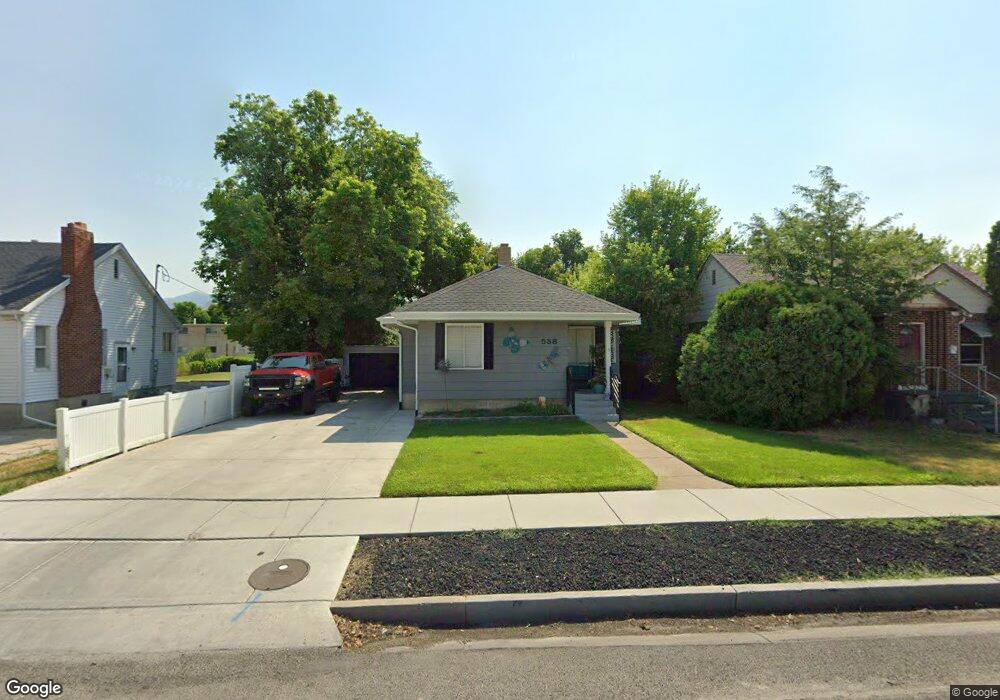
538 N 100 W Logan, UT 84321
Ellis NeighborhoodEstimated Value: $326,672 - $349,000
3
Beds
2
Baths
1,659
Sq Ft
$204/Sq Ft
Est. Value
About This Home
This home is located at 538 N 100 W, Logan, UT 84321 and is currently estimated at $339,168, approximately $204 per square foot. 538 N 100 W is a home located in Cache County with nearby schools including Ellis School, Mount Logan Middle School, and Logan High School.
Ownership History
Date
Name
Owned For
Owner Type
Purchase Details
Closed on
May 5, 2018
Sold by
Larsen Norman and Larsen Norman L
Bought by
Nll Holdings Llc
Current Estimated Value
Purchase Details
Closed on
Feb 12, 2015
Sold by
Tompkins Street Inc
Bought by
Larsen Norman
Purchase Details
Closed on
Aug 7, 2014
Sold by
Adams Verlene P and Republic Mortgage Home Loans L
Bought by
Tompkins Street Inc
Create a Home Valuation Report for This Property
The Home Valuation Report is an in-depth analysis detailing your home's value as well as a comparison with similar homes in the area
Home Values in the Area
Average Home Value in this Area
Purchase History
| Date | Buyer | Sale Price | Title Company |
|---|---|---|---|
| Nll Holdings Llc | -- | Northern Title | |
| Larsen Norman | -- | Heritage West Title | |
| Tompkins Street Inc | $64,731 | None Available |
Source: Public Records
Tax History
| Year | Tax Paid | Tax Assessment Tax Assessment Total Assessment is a certain percentage of the fair market value that is determined by local assessors to be the total taxable value of land and additions on the property. | Land | Improvement |
|---|---|---|---|---|
| 2025 | $1,361 | $176,065 | $0 | $0 |
| 2023 | $1,470 | $175,490 | $0 | $0 |
| 2022 | $1,600 | $178,420 | $0 | $0 |
| 2021 | $1,257 | $216,574 | $42,000 | $174,574 |
| 2020 | $1,137 | $176,288 | $42,000 | $134,288 |
| 2019 | $1,189 | $176,288 | $42,000 | $134,288 |
| 2018 | $1,196 | $161,900 | $42,000 | $119,900 |
| 2017 | $922 | $66,000 | $0 | $0 |
| 2016 | $956 | $60,500 | $0 | $0 |
| 2015 | $877 | $60,500 | $0 | $0 |
| 2014 | $793 | $60,500 | $0 | $0 |
| 2013 | -- | $60,500 | $0 | $0 |
Source: Public Records
Map
Nearby Homes
Your Personal Tour Guide
Ask me questions while you tour the home.