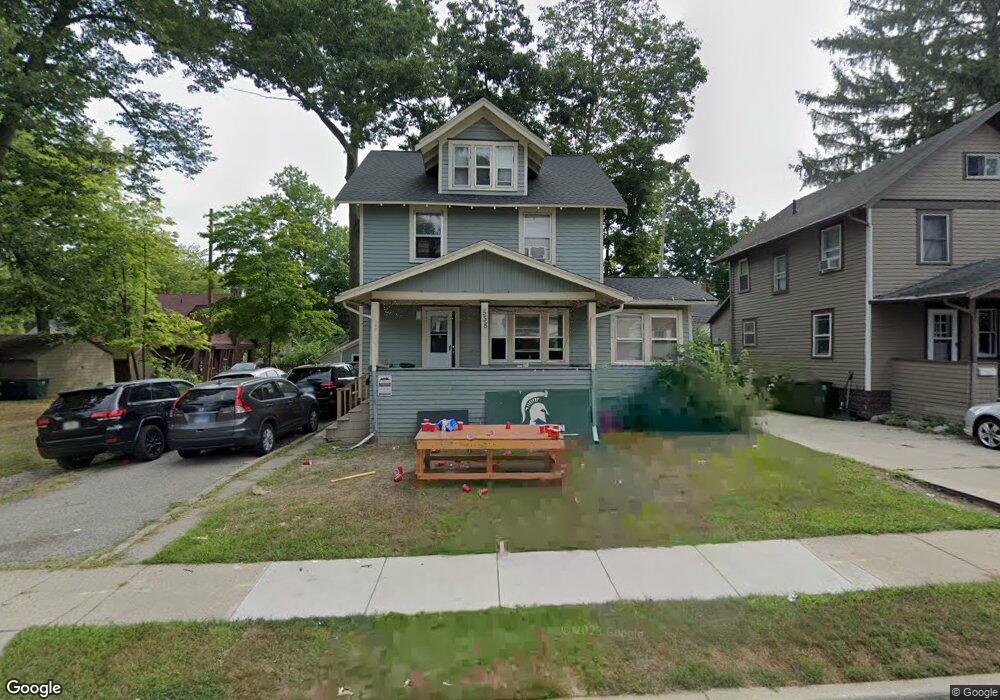
538 Park Ln East Lansing, MI 48823
Estimated Value: $306,000 - $362,000
5
Beds
1
Bath
1,566
Sq Ft
$219/Sq Ft
Est. Value
About This Home
This home is located at 538 Park Ln, East Lansing, MI 48823 and is currently estimated at $342,356, approximately $218 per square foot. 538 Park Ln is a home located in Ingham County with nearby schools including Marble Elementary School, MacDonald Middle School, and East Lansing High School.
Ownership History
Date
Name
Owned For
Owner Type
Purchase Details
Closed on
Dec 9, 2004
Sold by
Wells Jeffrey W and Goodsir Joseph W
Bought by
Wells Goodsir Investment Properties Inc
Current Estimated Value
Home Financials for this Owner
Home Financials are based on the most recent Mortgage that was taken out on this home.
Original Mortgage
$51,824
Outstanding Balance
$32,851
Interest Rate
10%
Mortgage Type
Purchase Money Mortgage
Estimated Equity
$309,505
Purchase Details
Closed on
May 1, 1977
Create a Home Valuation Report for This Property
The Home Valuation Report is an in-depth analysis detailing your home's value as well as a comparison with similar homes in the area
Home Values in the Area
Average Home Value in this Area
Purchase History
| Date | Buyer | Sale Price | Title Company |
|---|---|---|---|
| Wells Goodsir Investment Properties Inc | -- | Professional Title & Mortgag | |
| Wells Jeffrey W | $190,000 | Professional Title & Mortgag | |
| -- | $39,000 | -- |
Source: Public Records
Mortgage History
| Date | Status | Borrower | Loan Amount |
|---|---|---|---|
| Open | Wells Jeffrey W | $51,824 | |
| Open | Wells Goodsir Investment Properties Inc | $3,750,000 |
Source: Public Records
Tax History Compared to Growth
Tax History
| Year | Tax Paid | Tax Assessment Tax Assessment Total Assessment is a certain percentage of the fair market value that is determined by local assessors to be the total taxable value of land and additions on the property. | Land | Improvement |
|---|---|---|---|---|
| 2025 | $6,608 | $203,700 | $17,000 | $186,700 |
| 2024 | -- | $196,100 | $15,700 | $180,400 |
| 2023 | $6,202 | $178,800 | $13,900 | $164,900 |
| 2022 | $5,933 | $157,100 | $12,600 | $144,500 |
| 2021 | $5,810 | $153,300 | $11,300 | $142,000 |
| 2020 | $5,742 | $148,900 | $11,400 | $137,500 |
| 2019 | $5,538 | $130,300 | $13,000 | $117,300 |
| 2018 | $5,894 | $126,500 | $12,400 | $114,100 |
| 2017 | $5,686 | $122,700 | $14,000 | $108,700 |
| 2016 | -- | $120,200 | $13,900 | $106,300 |
| 2015 | -- | $112,400 | $26,863 | $85,537 |
| 2014 | -- | $107,100 | $26,671 | $80,429 |
Source: Public Records
Map
Nearby Homes
- 541 Forest St
- 539 Sunset Ln
- 635 Division St
- 317 Marshall St
- 353 Division St
- 220 Mac Ave Unit 302
- 351 Oakhill Ave Unit 207
- 357 Marshall St
- 904 Sunset Ln
- 341 Bailey St Unit 343
- 696 Beech St
- 415 W Grand River Ave
- 704 Beech St
- 408 Whitehills Dr
- 620 Ardson Rd
- 600 Albert St Unit 310
- 600 Albert Ave Unit 406
- 600 Albert Ave Unit 320
- 753 Snyder Rd
- 214 Kedzie St