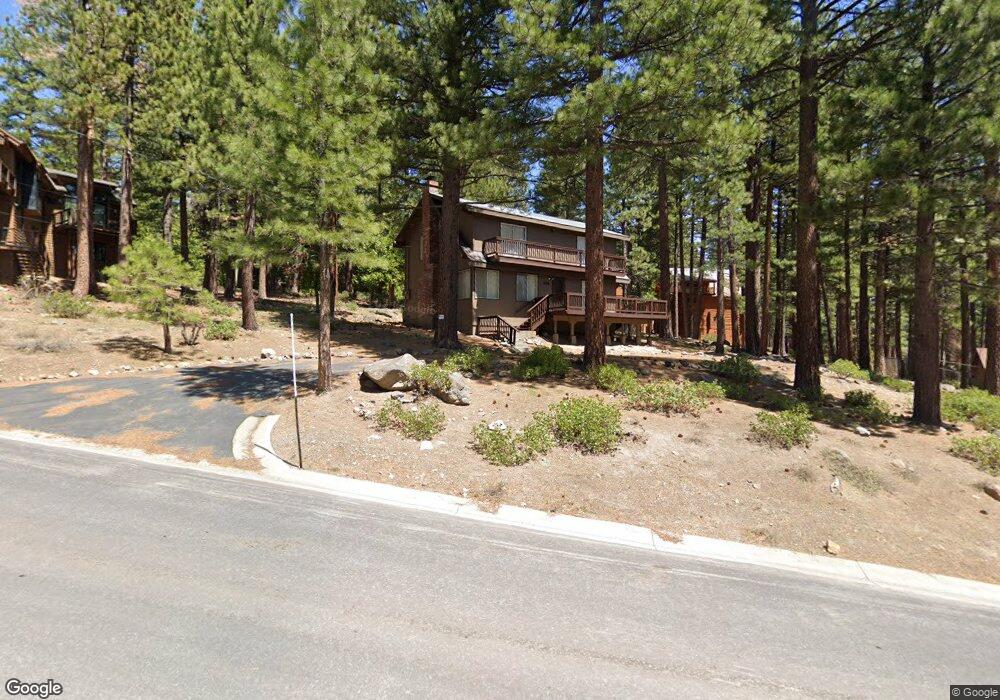
538 Spencer Way Incline Village, NV 89451
Estimated Value: $1,429,665 - $2,385,000
3
Beds
3
Baths
1,924
Sq Ft
$954/Sq Ft
Est. Value
About This Home
This home is located at 538 Spencer Way, Incline Village, NV 89451 and is currently estimated at $1,835,666, approximately $954 per square foot. 538 Spencer Way is a home located in Washoe County with nearby schools including Incline Elementary School, Incline Middle School, and Incline High School.
Create a Home Valuation Report for This Property
The Home Valuation Report is an in-depth analysis detailing your home's value as well as a comparison with similar homes in the area
Home Values in the Area
Average Home Value in this Area
Tax History Compared to Growth
Tax History
| Year | Tax Paid | Tax Assessment Tax Assessment Total Assessment is a certain percentage of the fair market value that is determined by local assessors to be the total taxable value of land and additions on the property. | Land | Improvement |
|---|---|---|---|---|
| 2025 | $4,335 | $187,700 | $157,500 | $30,200 |
| 2024 | $4,335 | $169,768 | $140,000 | $29,768 |
| 2023 | $4,228 | $150,057 | $122,500 | $27,557 |
| 2022 | $4,443 | $120,099 | $96,250 | $23,849 |
| 2021 | $4,336 | $108,683 | $85,750 | $22,933 |
| 2020 | $4,281 | $106,180 | $84,000 | $22,180 |
| 2019 | $4,180 | $99,591 | $78,750 | $20,841 |
| 2018 | $4,083 | $98,568 | $78,750 | $19,818 |
| 2017 | $3,988 | $98,058 | $78,750 | $19,308 |
| 2016 | $3,908 | $89,406 | $70,000 | $19,406 |
| 2015 | $1,951 | $88,879 | $70,000 | $18,879 |
| 2014 | $3,923 | $89,773 | $70,000 | $19,773 |
| 2013 | -- | $107,591 | $87,500 | $20,091 |
Source: Public Records
Map
Nearby Homes
- 539 Cole Cir
- 581 Tyner Way
- 563 Knotty Pine Dr
- 558 Valley Dr
- 573 Knotty Pine Dr
- 612 Tumbleweed Cir
- 527 Sugarpine Dr
- 553 Silvertip Dr
- 541 Silvertip Dr
- 580 Jackpine Ln
- 577 Fallen Leaf Way
- 572 Rockrose Ct
- 590 Fallen Leaf Way
- 501 Lakeshore Blvd Unit 30
- 501 Lakeshore Blvd Unit 56
- 655 Saddlehorn Dr
- 325 Woodridge Way
- 607 Crystal Peak Rd
- 698 Saddlehorn Dr
- 633 2nd Creek Dr
- 530 Spencer Way
- 542 Spencer Way
- 549 Lantern Ct
- 551 Lantern Ct
- 547 Lantern Ct
- 537 Spencer Way
- 539 Spencer Way
- 524 Spencer Way
- 546 Spencer Way
- 531 Spencer Way
- 553 Len Way
- 553 Lantern Ct
- 545 Spencer Way
- 527 Spencer Way
- 551 Spencer Way
- 525 Spencer Way
- 562 Tyner Way
- 546 Lantern Ct
- 550 Lantern Ct
- 538 Cole Cir