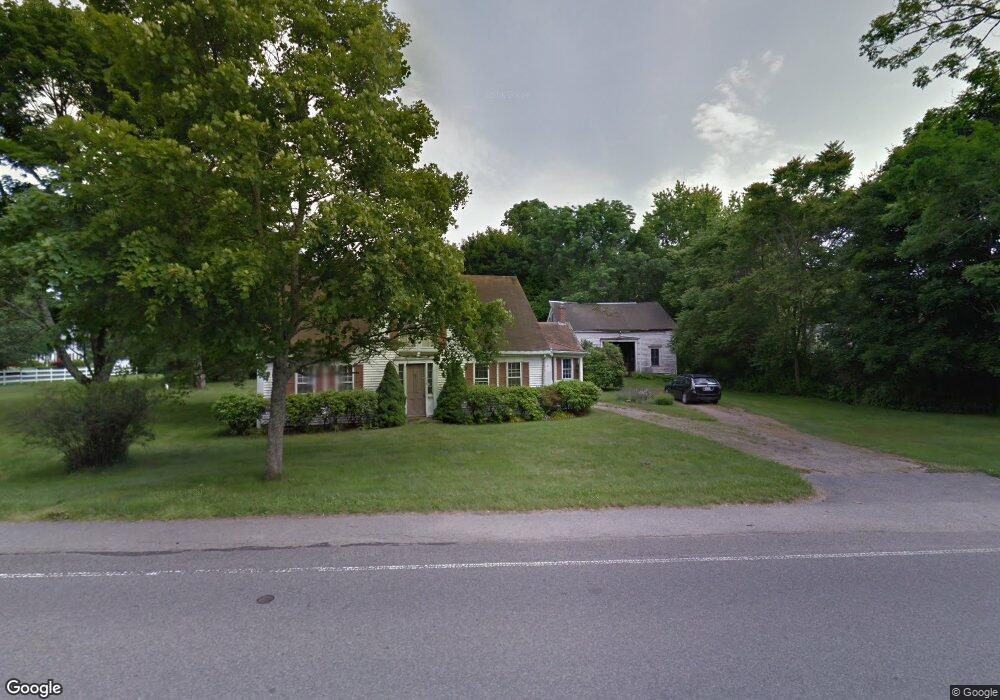
538 W Union St East Bridgewater, MA 02333
Estimated Value: $492,000 - $661,000
3
Beds
1
Bath
2,328
Sq Ft
$242/Sq Ft
Est. Value
About This Home
This home is located at 538 W Union St, East Bridgewater, MA 02333 and is currently estimated at $564,447, approximately $242 per square foot. 538 W Union St is a home located in Plymouth County with nearby schools including Central Elementary School, Gordon W Mitchell Middle School, and East Bridgewater Jr./Sr. High School.
Ownership History
Date
Name
Owned For
Owner Type
Purchase Details
Closed on
Apr 30, 1998
Sold by
Devlin George C and Devlin Theresa A
Bought by
Sullivan Margaret E
Current Estimated Value
Home Financials for this Owner
Home Financials are based on the most recent Mortgage that was taken out on this home.
Original Mortgage
$134,000
Outstanding Balance
$26,046
Interest Rate
7.04%
Mortgage Type
Purchase Money Mortgage
Estimated Equity
$538,401
Purchase Details
Closed on
Jan 27, 1995
Sold by
Dennis Robert W
Bought by
Devlin George C and Devlin Theresa A
Home Financials for this Owner
Home Financials are based on the most recent Mortgage that was taken out on this home.
Original Mortgage
$96,000
Interest Rate
9.24%
Mortgage Type
Purchase Money Mortgage
Create a Home Valuation Report for This Property
The Home Valuation Report is an in-depth analysis detailing your home's value as well as a comparison with similar homes in the area
Home Values in the Area
Average Home Value in this Area
Purchase History
| Date | Buyer | Sale Price | Title Company |
|---|---|---|---|
| Sullivan Margaret E | $149,000 | -- | |
| Devlin George C | $120,000 | -- |
Source: Public Records
Mortgage History
| Date | Status | Borrower | Loan Amount |
|---|---|---|---|
| Open | Devlin George C | $40,000 | |
| Open | Devlin George C | $134,000 | |
| Previous Owner | Devlin George C | $96,000 |
Source: Public Records
Tax History Compared to Growth
Tax History
| Year | Tax Paid | Tax Assessment Tax Assessment Total Assessment is a certain percentage of the fair market value that is determined by local assessors to be the total taxable value of land and additions on the property. | Land | Improvement |
|---|---|---|---|---|
| 2025 | $4,456 | $326,000 | $195,600 | $130,400 |
| 2024 | $4,448 | $321,400 | $188,100 | $133,300 |
| 2023 | $4,553 | $315,100 | $188,100 | $127,000 |
| 2022 | $4,454 | $285,500 | $171,100 | $114,400 |
| 2021 | $4,549 | $266,800 | $164,400 | $102,400 |
| 2020 | $4,487 | $259,500 | $158,100 | $101,400 |
| 2019 | $4,430 | $252,300 | $151,100 | $101,200 |
| 2018 | $9,173 | $247,700 | $151,100 | $96,600 |
| 2017 | $4,394 | $240,100 | $144,100 | $96,000 |
| 2016 | $4,340 | $239,000 | $144,100 | $94,900 |
| 2015 | $4,259 | $239,800 | $143,100 | $96,700 |
| 2014 | $4,158 | $239,400 | $140,100 | $99,300 |
Source: Public Records
Map
Nearby Homes