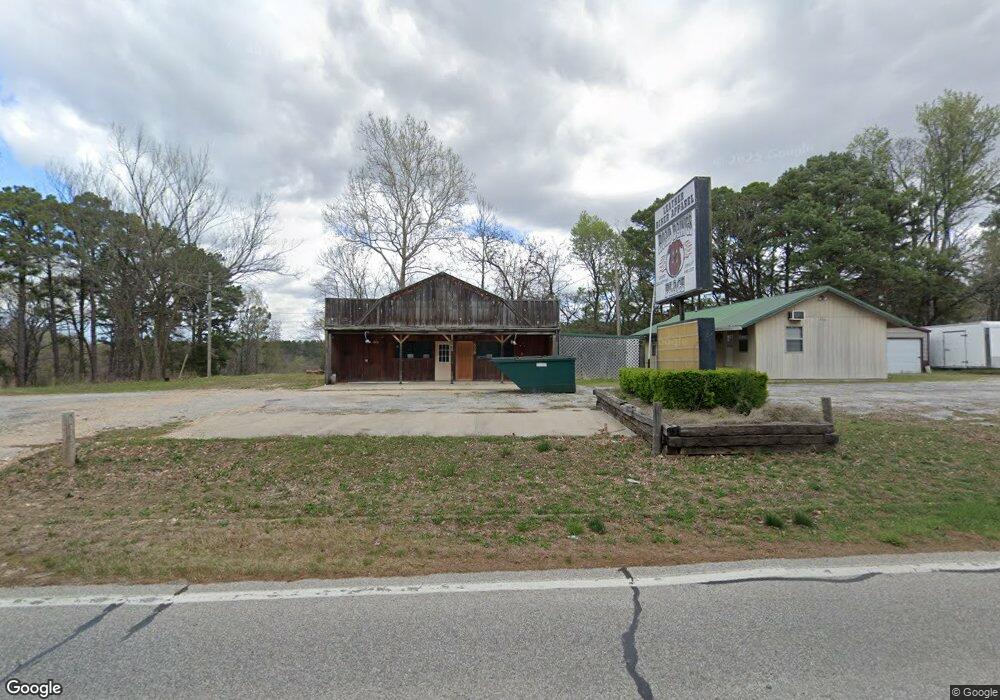
538 W Van Buren Eureka Springs, AR 72632
Estimated Value: $373,000
--
Bed
1
Bath
2,274
Sq Ft
$164/Sq Ft
Est. Value
About This Home
This home is located at 538 W Van Buren, Eureka Springs, AR 72632 and is currently priced at $373,000, approximately $164 per square foot. 538 W Van Buren is a home located in Carroll County with nearby schools including Eureka Springs Elementary School, Eureka Springs Middle School, and Eureka Springs High School.
Ownership History
Date
Name
Owned For
Owner Type
Purchase Details
Closed on
Jun 23, 2025
Sold by
Jallo Roger
Bought by
Mealer Roy and Mealer Mary
Current Estimated Value
Purchase Details
Closed on
Apr 1, 2025
Sold by
Commissioner Of State Lands
Bought by
Jallo Roger Jallo
Purchase Details
Closed on
Mar 26, 2025
Sold by
Jallo Roger
Bought by
Rodriguez Jose Luis Quinter and Quintero Camelia Medina
Purchase Details
Closed on
Sep 17, 2012
Sold by
Mealer Mary A and Smith James
Bought by
Mealer May Anna and Smith James
Purchase Details
Closed on
Nov 3, 2008
Sold by
Mealer Mary Anna
Bought by
Mealer Mary Anna and Smith James Aubry
Purchase Details
Closed on
Sep 24, 2008
Sold by
Not Provided
Bought by
Mealer Mary Anna
Purchase Details
Closed on
Apr 21, 2006
Sold by
Tharp
Bought by
Mealer
Purchase Details
Closed on
May 12, 2000
Sold by
Tharp
Bought by
Tharp R
Purchase Details
Closed on
Jan 12, 1988
Bought by
In Lue Of Foreclose
Purchase Details
Closed on
Mar 18, 1986
Bought by
Fr Fr R and Fr Tharp
Create a Home Valuation Report for This Property
The Home Valuation Report is an in-depth analysis detailing your home's value as well as a comparison with similar homes in the area
Home Values in the Area
Average Home Value in this Area
Purchase History
| Date | Buyer | Sale Price | Title Company |
|---|---|---|---|
| Mealer Roy | -- | Kings River Title | |
| Mealer Roy | -- | Kings River Title | |
| Jallo Roger Jallo | $4,224 | Kings River Title | |
| Rodriguez Jose Luis Quinter | $60,000 | Kings River Title | |
| Rodriguez Jose Luis Quinter | $60,000 | Kings River Title | |
| Mealer May Anna | -- | None Available | |
| Mealer Mary Anna | -- | None Available | |
| Mealer Mary Anna | -- | -- | |
| Mealer Mary Anna | -- | None Available | |
| Mealer | $140,000 | -- | |
| Tharp R | -- | -- | |
| In Lue Of Foreclose | -- | -- | |
| Fr Fr R | $185,000 | -- |
Source: Public Records
Tax History Compared to Growth
Tax History
| Year | Tax Paid | Tax Assessment Tax Assessment Total Assessment is a certain percentage of the fair market value that is determined by local assessors to be the total taxable value of land and additions on the property. | Land | Improvement |
|---|---|---|---|---|
| 2024 | $1,198 | $23,720 | $14,300 | $9,420 |
| 2023 | $1,198 | $23,720 | $14,300 | $9,420 |
| 2022 | $1,155 | $23,720 | $14,300 | $9,420 |
| 2021 | $1,051 | $20,790 | $14,300 | $6,490 |
| 2020 | $1,051 | $20,790 | $14,300 | $6,490 |
| 2019 | $1,069 | $31,450 | $19,940 | $11,510 |
| 2018 | $1,608 | $31,450 | $19,940 | $11,510 |
| 2017 | $1,607 | $31,450 | $19,940 | $11,510 |
| 2016 | $1,575 | $31,160 | $19,940 | $11,220 |
| 2015 | $1,575 | $31,160 | $19,940 | $11,220 |
| 2014 | -- | $31,160 | $19,940 | $11,220 |
Source: Public Records
Map
Nearby Homes
- 24 Dogwood Ridge
- 70 Dogwood Ridge
- 15 Pivot Rock Rd
- 331 W Van Buren
- TBD Pivot Rock Rd
- 274 Cr 1190
- 108 Jay Ln
- 3 Dairy Hollow Ct
- 107 Jay Ln
- 925-00041-000 Tbd Breezy Point
- 5 Kingshighway
- 331 Dairy Hollow Rd
- 5 Ojo St
- 0 Paxos St
- 35 Kingshighway
- 34 White St
- 0 Fritz St
- 30 Kingshighway
- 2 Vaughn St
- 5 Washington St
- 527 W Van Buren
- 560 W Van Buren
- 560 W Van Buren Unit 1, 2, 3, 4, 6, 7
- 7 Woolridge
- 9 Woolridge
- 0 W Van Buren St
- 0 Woolridge Unit 1003504
- 565 W Van Buren
- 10 Woolridge
- 192 Cooper Hollow Rd
- 11 Woolridge
- 536 W Van Buren
- 526 W Van Buren
- 10 Dogwood Ridge
- 580 W Van Buren
- 3 Dogwood Ridge
- 478 Cooper Hollow Rd
- 478 Cooper Hollow Rd
- 17 Dogwood Ridge
- 0 Off Pivot Rock Rd Unit 1161603