Estimated Value: $449,000 - $475,378
4
Beds
3
Baths
2,056
Sq Ft
$225/Sq Ft
Est. Value
About This Home
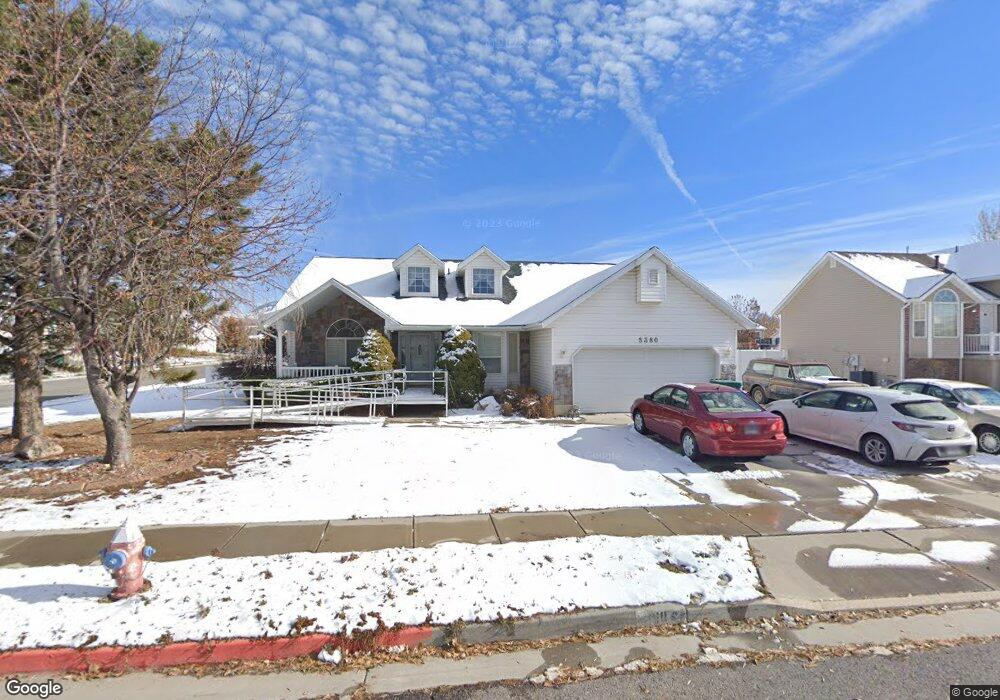
This home is located at 5380 S 3925 W, Roy, UT 84067 and is currently estimated at $462,095, approximately $224 per square foot. 5380 S 3925 W is a home located in Weber County with nearby schools including Freedom School, Roy Junior High School, and Roy High School.
Ownership History
Date
Name
Owned For
Owner Type
Purchase Details
Closed on
Oct 17, 2005
Sold by
Cendant Mobility Financial Corp
Bought by
Holden George and Holden Nadine
Current Estimated Value
Purchase Details
Closed on
Oct 7, 2005
Sold by
Allen Fred W and Allen Jonette S
Bought by
Cendant Mobility Financial Corp
Purchase Details
Closed on
Aug 20, 1999
Sold by
Haskell Homes Inc
Bought by
Allen Fred W and Allen Jonette S
Home Financials for this Owner
Home Financials are based on the most recent Mortgage that was taken out on this home.
Original Mortgage
$129,140
Interest Rate
7.25%
Create a Home Valuation Report for This Property
The Home Valuation Report is an in-depth analysis detailing your home's value as well as a comparison with similar homes in the area
Home Values in the Area
Average Home Value in this Area
Purchase History
| Date | Buyer | Sale Price | Title Company |
|---|---|---|---|
| Holden George | -- | First American Title | |
| Cendant Mobility Financial Corp | -- | First American Title | |
| Allen Fred W | -- | Bonneville Title Company |
Source: Public Records
Mortgage History
| Date | Status | Borrower | Loan Amount |
|---|---|---|---|
| Previous Owner | Allen Fred W | $129,140 |
Source: Public Records
Tax History
| Year | Tax Paid | Tax Assessment Tax Assessment Total Assessment is a certain percentage of the fair market value that is determined by local assessors to be the total taxable value of land and additions on the property. | Land | Improvement |
|---|---|---|---|---|
| 2025 | $2,847 | $455,518 | $130,241 | $325,277 |
| 2024 | $2,753 | $243,649 | $71,632 | $172,017 |
| 2023 | $2,784 | $248,050 | $67,156 | $180,894 |
| 2022 | $2,892 | $265,650 | $59,493 | $206,157 |
| 2021 | $2,264 | $340,000 | $82,313 | $257,687 |
| 2020 | $2,185 | $302,000 | $82,313 | $219,687 |
| 2019 | $2,107 | $274,000 | $46,848 | $227,152 |
| 2018 | $2,077 | $255,000 | $43,900 | $211,100 |
| 2017 | $1,933 | $222,000 | $43,900 | $178,100 |
| 2016 | $1,771 | $108,725 | $22,658 | $86,067 |
| 2015 | $1,599 | $100,073 | $22,658 | $77,415 |
| 2014 | $1,576 | $97,415 | $19,913 | $77,502 |
Source: Public Records
Map
Nearby Homes
- 5412 S 3925 W
- 3959 W 5325 S
- 5444 S 4050 W
- 5556 S 3800 W
- 3832 W 5625 S
- 4021 W 5625 S
- 4216 W 5250 S
- 4088 W 5050 S
- 4277 W 5250 S
- 3826 W 5750 S
- 4218 W 5050 S
- 4309 W 5430 St #B S
- 5773 S 3850 W
- 4337 W 5430 St S A S Unit A
- 4367 W 5300 S
- 4950 3900 West St
- 3443 W 5200 S Unit 2&3
- 5856 S 3950 W
- 4813 S 3850 W
- 3509 W 4835 S Unit 26
Your Personal Tour Guide
Ask me questions while you tour the home.