Estimated Value: $364,000 - $395,570
4
Beds
2
Baths
2,000
Sq Ft
$191/Sq Ft
Est. Value
About This Home
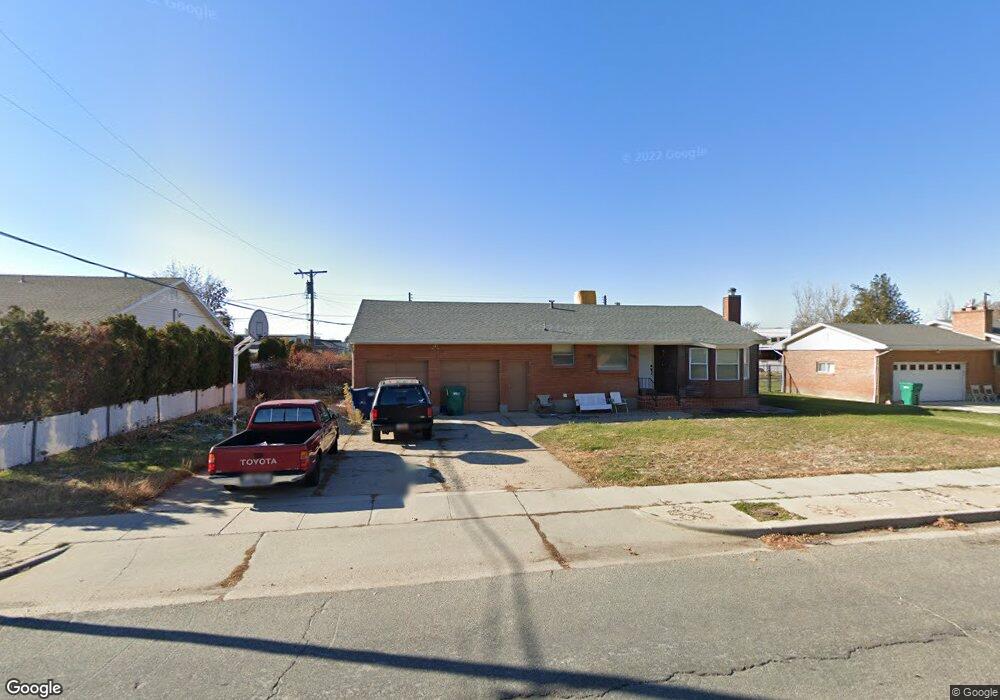
This home is located at 5381 S 2050 W, Roy, UT 84067 and is currently estimated at $382,643, approximately $191 per square foot. 5381 S 2050 W is a home located in Weber County with nearby schools including Lakeview Elementary School, Roy Junior High School, and Roy High School.
Ownership History
Date
Name
Owned For
Owner Type
Purchase Details
Closed on
Jun 3, 2021
Sold by
Porter David R and Porter Lizette M
Bought by
Porter David Richard and Porter Lizette Marie
Current Estimated Value
Home Financials for this Owner
Home Financials are based on the most recent Mortgage that was taken out on this home.
Original Mortgage
$213,675
Outstanding Balance
$193,456
Interest Rate
2.9%
Mortgage Type
FHA
Estimated Equity
$189,187
Purchase Details
Closed on
Apr 29, 2003
Sold by
Harrop Jeff C and Harrop Erin L
Bought by
Porter David R
Home Financials for this Owner
Home Financials are based on the most recent Mortgage that was taken out on this home.
Original Mortgage
$112,500
Interest Rate
9.99%
Mortgage Type
Purchase Money Mortgage
Purchase Details
Closed on
Nov 24, 1997
Sold by
The Bretwood Co Inc
Bought by
Harrop Jeffrey Curtis and Harrop Erin Leigh
Home Financials for this Owner
Home Financials are based on the most recent Mortgage that was taken out on this home.
Original Mortgage
$40,990
Interest Rate
7.23%
Create a Home Valuation Report for This Property
The Home Valuation Report is an in-depth analysis detailing your home's value as well as a comparison with similar homes in the area
Home Values in the Area
Average Home Value in this Area
Purchase History
| Date | Buyer | Sale Price | Title Company |
|---|---|---|---|
| Porter David Richard | -- | Metro National Title | |
| Porter David R | -- | Advanced Title | |
| Harrop Jeffrey Curtis | -- | Security Title |
Source: Public Records
Mortgage History
| Date | Status | Borrower | Loan Amount |
|---|---|---|---|
| Open | Porter David Richard | $213,675 | |
| Closed | Porter David R | $112,500 | |
| Previous Owner | Harrop Jeffrey Curtis | $40,990 |
Source: Public Records
Tax History Compared to Growth
Tax History
| Year | Tax Paid | Tax Assessment Tax Assessment Total Assessment is a certain percentage of the fair market value that is determined by local assessors to be the total taxable value of land and additions on the property. | Land | Improvement |
|---|---|---|---|---|
| 2025 | $2,410 | $375,982 | $130,645 | $245,337 |
| 2024 | $2,355 | $203,499 | $71,855 | $131,644 |
| 2023 | $2,179 | $187,550 | $67,521 | $120,029 |
| 2022 | $2,008 | $176,001 | $57,910 | $118,091 |
| 2021 | $1,739 | $251,000 | $74,654 | $176,346 |
| 2020 | $1,629 | $216,000 | $74,654 | $141,346 |
| 2019 | $1,684 | $212,000 | $43,995 | $168,005 |
| 2018 | $1,516 | $178,000 | $38,632 | $139,368 |
| 2017 | $1,478 | $163,000 | $38,632 | $124,368 |
| 2016 | $1,324 | $77,556 | $17,626 | $59,930 |
| 2015 | $1,216 | $72,539 | $17,626 | $54,913 |
| 2014 | $1,225 | $72,539 | $17,626 | $54,913 |
Source: Public Records
Map
Nearby Homes
- 2184 W 5500 S
- 5545 S 2100 W Unit 20
- 5545 S 2100 W Unit 12
- 5545 S 2100 W Unit D22
- 5368 S 2200 W
- 5573 S 2150 W
- 5256 S 2000 W
- 2146 W 5600 S Unit 29
- 2270 W 5500 S
- 5261 S 2200 W
- 5185 S 2100 W
- 5140 S 2100 W
- 5643 S 2200 W
- 5508 S 2375 W
- 5140 S 2175 W
- 2266 W 5100 S
- 2179 W 4975 S
- 1789 W 5050 S
- 1777 W 5050 S
- 5902 S 1900 W