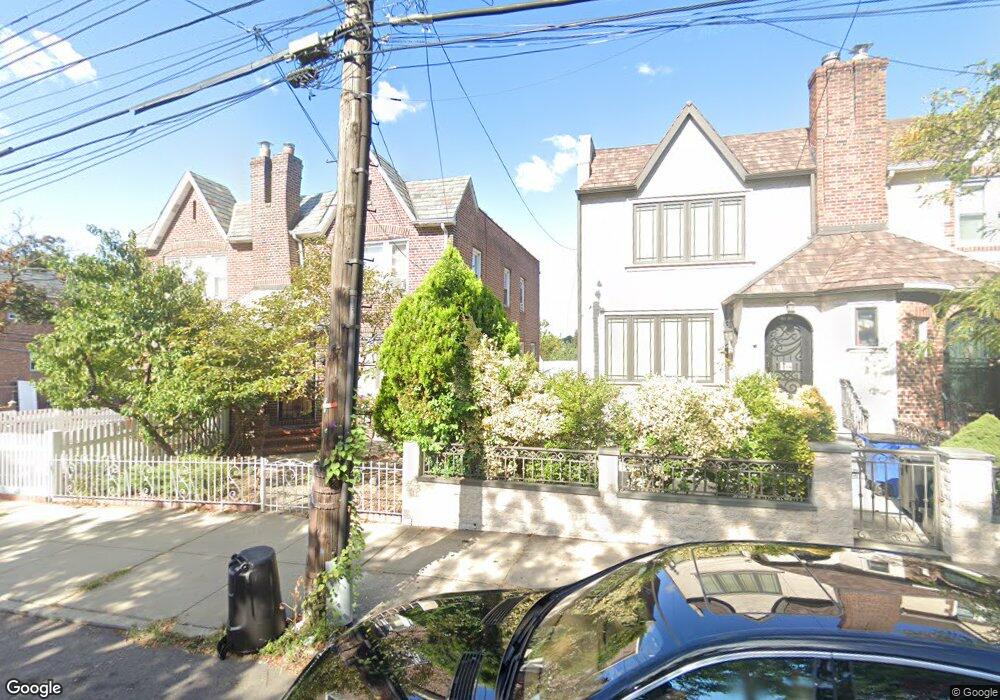
5382 63rd St Maspeth, NY 11378
Maspeth NeighborhoodEstimated Value: $948,000 - $957,000
Studio
--
Bath
2,090
Sq Ft
$456/Sq Ft
Est. Value
About This Home
This home is located at 5382 63rd St, Maspeth, NY 11378 and is currently estimated at $953,295, approximately $456 per square foot. 5382 63rd St is a home located in Queens County with nearby schools including P.S. 229 Emanuel Kaplan, IS 73 - The Frank Sansivieri School, and Grover Cleveland High School.
Ownership History
Date
Name
Owned For
Owner Type
Purchase Details
Closed on
Jun 18, 2007
Sold by
Caliendo Gabrielie and Caliendo Joseph
Bought by
Chinsena Savee
Current Estimated Value
Home Financials for this Owner
Home Financials are based on the most recent Mortgage that was taken out on this home.
Original Mortgage
$86,900
Outstanding Balance
$53,060
Interest Rate
6.24%
Estimated Equity
$900,235
Purchase Details
Closed on
Jun 3, 2002
Sold by
Massaro Maria Elaine and Caliendo Gabrielie
Bought by
Caliendo Rosa
Purchase Details
Closed on
Jan 28, 2002
Sold by
Caliendo Rosa and Caliendo Rosa Surviv
Bought by
Massaro Maria Elaine and Caliendo Gabrielie
Create a Home Valuation Report for This Property
The Home Valuation Report is an in-depth analysis detailing your home's value as well as a comparison with similar homes in the area
Home Values in the Area
Average Home Value in this Area
Purchase History
| Date | Buyer | Sale Price | Title Company |
|---|---|---|---|
| Chinsena Savee | $560,000 | -- | |
| Chinsena Savee | $560,000 | -- | |
| Caliendo Rosa | -- | -- | |
| Caliendo Rosa | -- | -- | |
| Massaro Maria Elaine | -- | -- | |
| Massaro Maria Elaine | -- | -- |
Source: Public Records
Mortgage History
| Date | Status | Borrower | Loan Amount |
|---|---|---|---|
| Open | Chinsena Savee | $86,900 | |
| Closed | Chinsena Savee | $86,900 | |
| Open | Chinsena Savee | $417,000 | |
| Closed | Chinsena Savee | $417,000 |
Source: Public Records
Tax History
| Year | Tax Paid | Tax Assessment Tax Assessment Total Assessment is a certain percentage of the fair market value that is determined by local assessors to be the total taxable value of land and additions on the property. | Land | Improvement |
|---|---|---|---|---|
| 2025 | $8,156 | $42,280 | $6,168 | $36,112 |
| 2024 | $8,156 | $40,608 | $5,565 | $35,043 |
| 2023 | $7,858 | $39,122 | $5,181 | $33,941 |
| 2022 | $7,381 | $58,260 | $8,700 | $49,560 |
| 2021 | $7,419 | $55,560 | $8,700 | $46,860 |
| 2020 | $7,458 | $54,420 | $8,700 | $45,720 |
| 2019 | $7,079 | $55,920 | $8,700 | $47,220 |
| 2018 | $6,646 | $32,602 | $5,675 | $26,927 |
| 2017 | $6,281 | $30,812 | $6,103 | $24,709 |
| 2016 | $5,873 | $30,812 | $6,103 | $24,709 |
| 2015 | $3,506 | $29,361 | $8,114 | $21,247 |
| 2014 | $3,506 | $28,200 | $9,120 | $19,080 |
Source: Public Records
Map
Nearby Homes
- 53-26 61st St
- 5337 62nd St
- 5351 63rd St
- 62-15 53rd Ave Unit LGD
- 5428 65th Place
- 53-54 66th St
- 5307 65th Place
- 53-36 66th St
- 52-60 65th Place Unit 5E
- 53-24 66th St
- 52-24 65th Place Unit 3K
- 53-36 67th St
- 52-61 66th St
- 52-21 65th Place Unit 6P
- 5221 65th Place Unit 6N
- 6040 55th Dr
- 52-15 65th Place Unit 3A
- 52-62 68th St
- 61-54 56th Ave
- 66-17 Clinton Ave
Your Personal Tour Guide
Ask me questions while you tour the home.