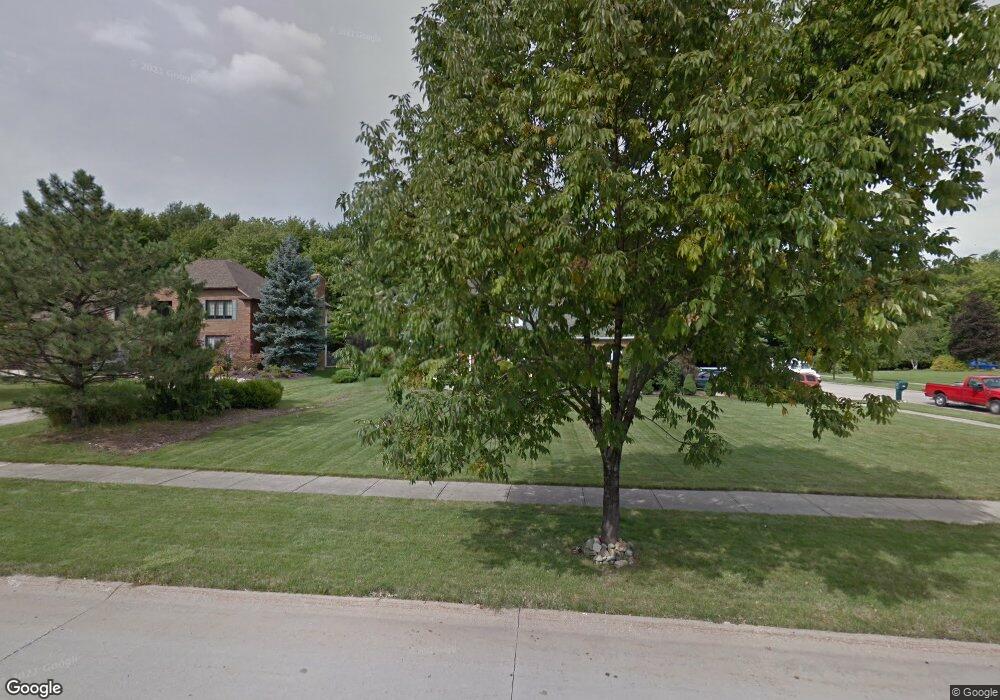
5383 Pine Ridge Oval Independence, OH 44131
Estimated Value: $619,132 - $760,000
6
Beds
5
Baths
3,434
Sq Ft
$201/Sq Ft
Est. Value
About This Home
This home is located at 5383 Pine Ridge Oval, Independence, OH 44131 and is currently estimated at $689,283, approximately $200 per square foot. 5383 Pine Ridge Oval is a home located in Cuyahoga County with nearby schools including Independence Primary School, Independence Middle School, and Independence High School.
Ownership History
Date
Name
Owned For
Owner Type
Purchase Details
Closed on
Jan 6, 2023
Sold by
Moore Raymond D and Moore Joanne M
Bought by
Moore Jonathon and Moore Brooke
Current Estimated Value
Home Financials for this Owner
Home Financials are based on the most recent Mortgage that was taken out on this home.
Original Mortgage
$428,041
Outstanding Balance
$415,714
Interest Rate
6.99%
Mortgage Type
FHA
Estimated Equity
$273,569
Purchase Details
Closed on
Jun 1, 2009
Sold by
Moore Pansy M
Bought by
Moore Raymond D and Moore Joanne M
Purchase Details
Closed on
May 29, 1992
Sold by
Shiue Hwa-Chung
Bought by
Moore Raymone D
Purchase Details
Closed on
May 18, 1990
Bought by
Shiue Hwa-Chung
Purchase Details
Closed on
Aug 22, 1989
Bought by
Custom Homes Of America, Inc
Purchase Details
Closed on
Jan 1, 1988
Bought by
H D Dev Co
Create a Home Valuation Report for This Property
The Home Valuation Report is an in-depth analysis detailing your home's value as well as a comparison with similar homes in the area
Home Values in the Area
Average Home Value in this Area
Purchase History
| Date | Buyer | Sale Price | Title Company |
|---|---|---|---|
| Moore Jonathon | $510,000 | Ohio Real Title | |
| Moore Raymond D | -- | Ohio Real Title | |
| Moore Raymone D | $260,000 | -- | |
| Shiue Hwa-Chung | $246,600 | -- | |
| Custom Homes Of America, Inc | -- | -- | |
| H D Dev Co | -- | -- |
Source: Public Records
Mortgage History
| Date | Status | Borrower | Loan Amount |
|---|---|---|---|
| Open | Moore Jonathon | $428,041 |
Source: Public Records
Tax History Compared to Growth
Tax History
| Year | Tax Paid | Tax Assessment Tax Assessment Total Assessment is a certain percentage of the fair market value that is determined by local assessors to be the total taxable value of land and additions on the property. | Land | Improvement |
|---|---|---|---|---|
| 2024 | $8,068 | $178,500 | $43,680 | $134,820 |
| 2023 | $7,374 | $149,280 | $32,520 | $116,760 |
| 2022 | $7,356 | $149,280 | $32,520 | $116,760 |
| 2021 | $7,249 | $149,280 | $32,520 | $116,760 |
| 2020 | $7,048 | $136,960 | $29,820 | $107,140 |
| 2019 | $6,804 | $391,300 | $85,200 | $306,100 |
| 2018 | $6,865 | $136,960 | $29,820 | $107,140 |
| 2017 | $7,415 | $142,210 | $24,540 | $117,670 |
| 2016 | $7,340 | $142,210 | $24,540 | $117,670 |
| 2015 | $10,337 | $142,210 | $24,540 | $117,670 |
| 2014 | $10,337 | $131,680 | $22,720 | $108,960 |
Source: Public Records
Map
Nearby Homes
- 4712 Hillside Rd
- 4912 Hillside Rd
- 7004 Filip Blvd
- VL TBB Laura Lee Ln
- VL Laura Lee Ln
- 7020 Donna Rae Dr
- 6312 E Pleasant Valley Rd
- 7160 Brecksville Rd
- 5108 Great Oaks Pkwy
- 2703 Pasadena Dr
- 7454 S Cricket Ln
- 6835 E Pleasant Valley Rd
- 1787 Nemet Dr
- 7572 Scenicview Dr
- 6216 Ranchview Dr
- 1599 Hillside Rd
- 0 Brecksville Rd
- 1286 Cherry Ln
- 1682 E Parkhaven Dr
- 7426 Stone Rd
- 5375 Pine Ridge Oval
- 5225 Pine Ridge Oval
- 5370 Acacia Ct
- 5260 Acacia Ct
- 7035 Great Oaks Pkwy
- 7035 S Great Oaks Pkwy
- 5350 Pine Ridge Oval
- 7025 Great Oaks Pkwy
- 5320 Pine Ridge Oval
- 5175 Pine Ridge Oval
- 7045 Great Oaks Pkwy
- 5180 Acacia Ct
- 7005 S Great Oaks Pkwy
- 5300 Pine Ridge Oval
- 7055 Great Oaks Pkwy
- 5025 Pine Ridge Oval
- 5100 Pine Ridge Oval
- 5299 Hillside Rd
- 5000 Acacia Ct
- 5319 Hillside Rd