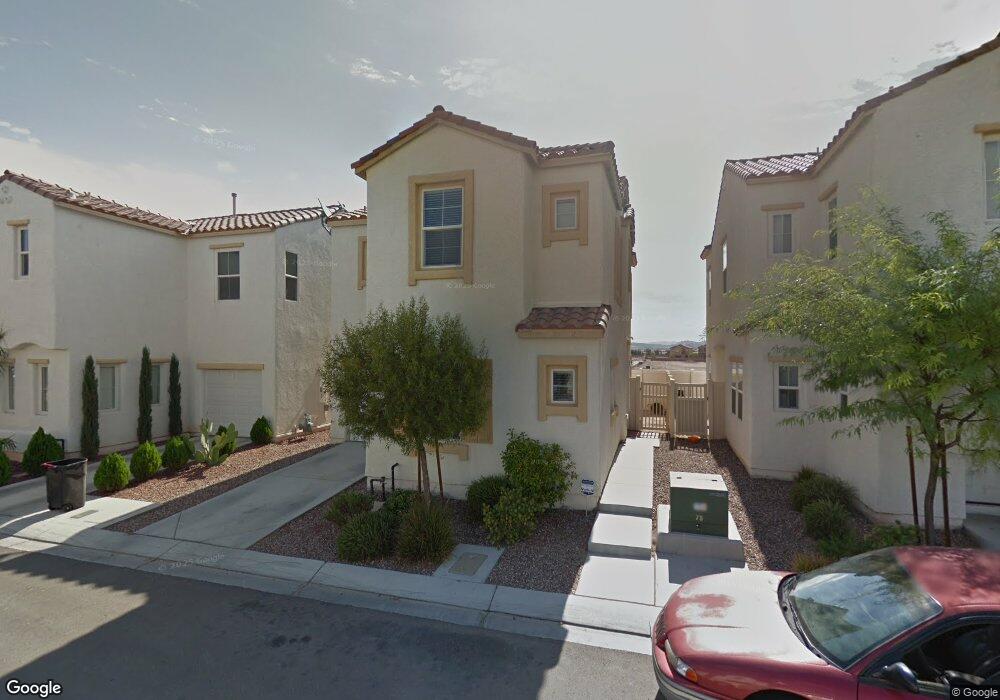
5384 Flowing Spring St Las Vegas, NV 89122
Estimated Value: $331,000 - $374,000
3
Beds
3
Baths
1,685
Sq Ft
$212/Sq Ft
Est. Value
About This Home
This home is located at 5384 Flowing Spring St, Las Vegas, NV 89122 and is currently estimated at $356,837, approximately $211 per square foot. 5384 Flowing Spring St is a home located in Clark County with nearby schools including Sister Robert Joseph Bailey Elementary School, Francis H Cortney Junior High School, and Basic Academy of International Studies.
Ownership History
Date
Name
Owned For
Owner Type
Purchase Details
Closed on
Oct 28, 2020
Sold by
Tricon Sfr 2020 2 Borrower Llc
Bought by
Tricon Sfr 2020 2 Borrower Llc
Current Estimated Value
Purchase Details
Closed on
Oct 25, 2016
Sold by
Tah Securitized Rsp Llc
Bought by
Equity Owner Llc
Purchase Details
Closed on
May 15, 2015
Sold by
Bouleder Garden Co Lp
Bought by
Tah Holding Lp
Create a Home Valuation Report for This Property
The Home Valuation Report is an in-depth analysis detailing your home's value as well as a comparison with similar homes in the area
Home Values in the Area
Average Home Value in this Area
Purchase History
| Date | Buyer | Sale Price | Title Company |
|---|---|---|---|
| Tricon Sfr 2020 2 Borrower Llc | -- | Os National Resware | |
| Equity Owner Llc | -- | None Available | |
| Tah Securitized Rsp Llc | -- | Os National Llc | |
| Tah Equity Lp | -- | None Available | |
| Tah Holding Lp | $2,250,000 | First American Title Ncs La |
Source: Public Records
Tax History Compared to Growth
Tax History
| Year | Tax Paid | Tax Assessment Tax Assessment Total Assessment is a certain percentage of the fair market value that is determined by local assessors to be the total taxable value of land and additions on the property. | Land | Improvement |
|---|---|---|---|---|
| 2025 | $1,128 | $90,414 | $24,150 | $66,264 |
| 2024 | $1,045 | $90,414 | $24,150 | $66,264 |
| 2023 | $1,045 | $89,004 | $26,600 | $62,404 |
| 2022 | $968 | $78,089 | $21,350 | $56,739 |
| 2021 | $897 | $69,465 | $21,000 | $48,465 |
| 2020 | $830 | $67,395 | $21,000 | $46,395 |
| 2019 | $1,539 | $66,504 | $17,150 | $49,354 |
| 2018 | $742 | $54,104 | $14,700 | $39,404 |
| 2017 | $1,547 | $52,737 | $14,000 | $38,737 |
| 2016 | $696 | $46,736 | $7,350 | $39,386 |
| 2015 | $946 | $34,729 | $4,550 | $30,179 |
| 2014 | -- | $22,219 | $4,550 | $17,669 |
Source: Public Records
Map
Nearby Homes
- 5377 Panaca Spring St
- 6156 Kinnow Place
- 6409 Dundock Ave
- 5480 Verbena Lime Ln
- 6443 Burlap Ct
- 6415 Broadcloth Ct
- 6119 Berthelot Ln
- 6237 Clackamas Ct
- 6512 Chettle House Ln
- 6213 Clackamas Ct
- 6240 Clackamas Ct
- 5344 Cape Henry St
- 5314 Cape Henry St
- 5308 Cape Henry St
- 5252 Nevada Ave
- 6380 Alderlyn Ave
- 6019 Clark St
- 6259 Whippet Ave
- 5943 Willard St
- 5330 Rod Ct Unit 102
- 5388 Flowing Spring St Unit None
- 5388 Flowing Spring St
- 5392 Flowing Spring St
- 5391 Glenburnie St
- 5376 Flowing Spring St
- 5376 Flowing Spring St Unit None
- 5399 Glenburnie St
- 5383 Glenburnie St
- 5383 Flowing Spring St
- 5383 Flowing Spring St
- 5407 Glenburnie St
- 5396 Flowing Spring St
- 5372 Flowing Spring St
- 5379 Flowing Spring St
- 5375 Glenburnie St
- 6319 Solomon Spring Way
- 5375 Flowing Spring St
- 5415 Glenburnie St
- 5368 Flowing Spring St
- 5367 Glenburnie St