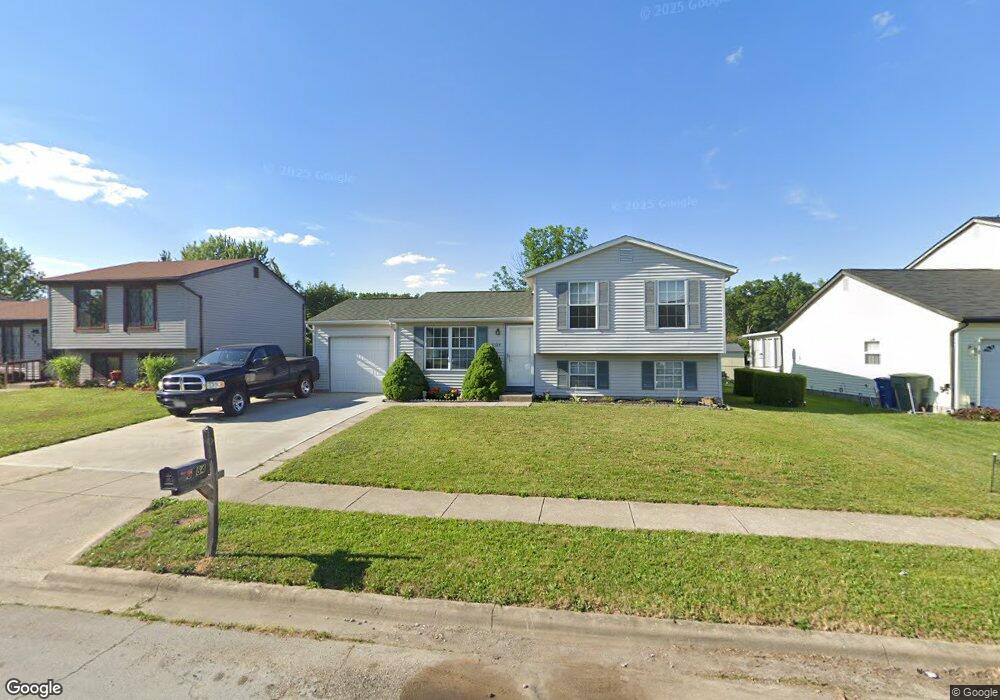
5384 Wesliegh Run Dr Columbus, OH 43228
Cherry Creek NeighborhoodEstimated Value: $249,000 - $267,000
3
Beds
2
Baths
1,178
Sq Ft
$220/Sq Ft
Est. Value
About This Home
This home is located at 5384 Wesliegh Run Dr, Columbus, OH 43228 and is currently estimated at $258,862, approximately $219 per square foot. 5384 Wesliegh Run Dr is a home located in Franklin County with nearby schools including Prairie Norton Elementary School, Holt Crossing Intermediate School, and Pleasant View Middle School.
Ownership History
Date
Name
Owned For
Owner Type
Purchase Details
Closed on
Jul 6, 2007
Sold by
Plympton James A and Plympton Theresa J
Bought by
Revilla Apolonia Gloria and Espino Jesus Ismael Diaz
Current Estimated Value
Purchase Details
Closed on
Jul 1, 1996
Sold by
Evans Jeffrey C
Bought by
Plymton James A and Plymton Theresa J
Home Financials for this Owner
Home Financials are based on the most recent Mortgage that was taken out on this home.
Original Mortgage
$81,135
Outstanding Balance
$5,808
Interest Rate
8.13%
Mortgage Type
FHA
Estimated Equity
$253,054
Purchase Details
Closed on
Nov 5, 1993
Purchase Details
Closed on
Dec 22, 1989
Create a Home Valuation Report for This Property
The Home Valuation Report is an in-depth analysis detailing your home's value as well as a comparison with similar homes in the area
Home Values in the Area
Average Home Value in this Area
Purchase History
| Date | Buyer | Sale Price | Title Company |
|---|---|---|---|
| Revilla Apolonia Gloria | $106,000 | Chicago Tit | |
| Plymton James A | $83,000 | -- | |
| -- | -- | -- | |
| -- | $72,700 | -- |
Source: Public Records
Mortgage History
| Date | Status | Borrower | Loan Amount |
|---|---|---|---|
| Open | Plymton James A | $81,135 |
Source: Public Records
Tax History Compared to Growth
Tax History
| Year | Tax Paid | Tax Assessment Tax Assessment Total Assessment is a certain percentage of the fair market value that is determined by local assessors to be the total taxable value of land and additions on the property. | Land | Improvement |
|---|---|---|---|---|
| 2024 | $2,799 | $76,760 | $25,660 | $51,100 |
| 2023 | $2,749 | $76,760 | $25,660 | $51,100 |
| 2022 | $1,843 | $37,770 | $9,700 | $28,070 |
| 2021 | $1,880 | $37,770 | $9,700 | $28,070 |
| 2020 | $1,870 | $37,770 | $9,700 | $28,070 |
| 2019 | $1,785 | $31,820 | $8,090 | $23,730 |
| 2018 | $1,785 | $31,820 | $8,090 | $23,730 |
| 2017 | $1,769 | $31,820 | $8,090 | $23,730 |
| 2016 | $1,794 | $29,650 | $7,000 | $22,650 |
| 2015 | $1,794 | $29,650 | $7,000 | $22,650 |
| 2014 | $1,796 | $29,650 | $7,000 | $22,650 |
| 2013 | $938 | $31,220 | $7,385 | $23,835 |
Source: Public Records
Map
Nearby Homes
- 840 Cherry Bud Dr
- 805 Pipers Ln
- 4950 Cherry Creek Pkwy S
- 5261 Marci Way Unit D
- 5261 Marci Way Unit 4D
- 542 Clairbrook Ave Unit 11
- 491 Clairbrook Ave Unit 3
- 5006 Old Tree Ave
- 515 Clairbrook Ave
- 477 Clairbrook Ave
- 4848 Deephollow Dr
- 631 Dlyn St Unit 12
- 452 Pamlico St Unit 9
- 0 Hall Rd
- 417 Pamlico St Unit JK2
- 429 Postle Blvd
- 866 Riggsby Rd
- 5715 Oyster Bay Way
- 5722 Silver Spurs Ln
- 435 Redmond Rd
- 5392 Wesliegh Run Dr
- 5376 Wesliegh Run Dr
- 5400 Wesliegh Run Dr
- 5368 Wesliegh Run Dr
- 5375 Cherry Creek Pkwy S
- 5367 Cherry Creek
- 5383 S Cherry Creek
- 5383 Cherry Creek
- 5383 Cherry Creek Pkwy S
- 5408 Wesliegh Run Dr
- 5359 S Cherry Creek
- 5360 Wesliegh Run Dr
- 5391 Wesliegh Run Dr
- 5383 Wesliegh Run Dr
- 5399 Wesliegh Run Dr
- 5391 S Cherry Creek
- 5391 Cherry Creek Pkwy S
- 5367 Cherry Creek Pkwy S
- 5377 Wesliegh Run Dr
- 5405 Wesliegh Run Dr