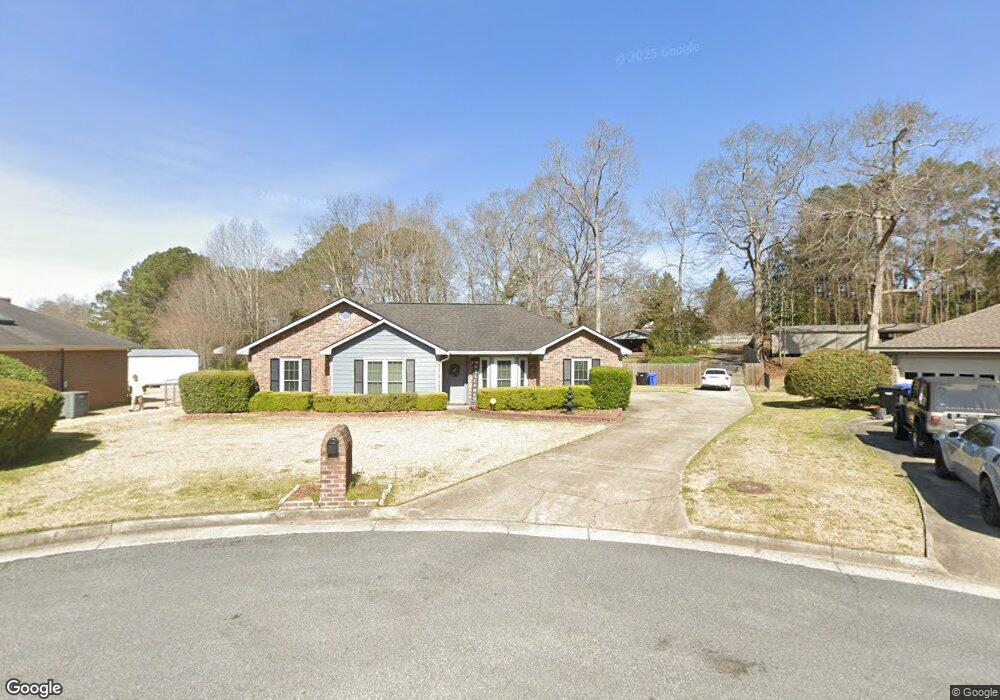
5385 McCaghren Dr Columbus, GA 31909
Midland NeighborhoodEstimated Value: $276,000 - $295,000
3
Beds
3
Baths
2,284
Sq Ft
$125/Sq Ft
Est. Value
About This Home
This home is located at 5385 McCaghren Dr, Columbus, GA 31909 and is currently estimated at $285,378, approximately $124 per square foot. 5385 McCaghren Dr is a home located in Muscogee County with nearby schools including Eagle Ridge Academy, Midland Middle School, and Shaw High School.
Ownership History
Date
Name
Owned For
Owner Type
Purchase Details
Closed on
Aug 22, 2017
Sold by
Ross Paul E
Bought by
Cunningham Frank
Current Estimated Value
Home Financials for this Owner
Home Financials are based on the most recent Mortgage that was taken out on this home.
Original Mortgage
$175,000
Outstanding Balance
$145,866
Interest Rate
3.92%
Mortgage Type
VA
Estimated Equity
$139,512
Purchase Details
Closed on
Jun 12, 2008
Sold by
Wright Mary J and Ross Mary J
Bought by
Ross Paul E
Purchase Details
Closed on
Apr 3, 2008
Sold by
Wright Mary J and Ross Mary J
Bought by
Ross Mary J and Ross Paul E
Home Financials for this Owner
Home Financials are based on the most recent Mortgage that was taken out on this home.
Original Mortgage
$137,802
Interest Rate
6.22%
Mortgage Type
Purchase Money Mortgage
Create a Home Valuation Report for This Property
The Home Valuation Report is an in-depth analysis detailing your home's value as well as a comparison with similar homes in the area
Home Values in the Area
Average Home Value in this Area
Purchase History
| Date | Buyer | Sale Price | Title Company |
|---|---|---|---|
| Cunningham Frank | $175,000 | -- | |
| Ross Paul E | -- | None Available | |
| Ross Mary J | $414,000 | Chicago Title |
Source: Public Records
Mortgage History
| Date | Status | Borrower | Loan Amount |
|---|---|---|---|
| Open | Cunningham Frank | $175,000 | |
| Previous Owner | Ross Mary J | $137,802 |
Source: Public Records
Tax History Compared to Growth
Tax History
| Year | Tax Paid | Tax Assessment Tax Assessment Total Assessment is a certain percentage of the fair market value that is determined by local assessors to be the total taxable value of land and additions on the property. | Land | Improvement |
|---|---|---|---|---|
| 2025 | -- | $113,236 | $14,316 | $98,920 |
| 2024 | -- | $113,236 | $14,316 | $98,920 |
| 2023 | $0 | $113,236 | $14,316 | $98,920 |
| 2022 | $1,430 | $84,252 | $14,316 | $69,936 |
| 2021 | $2,173 | $80,360 | $14,316 | $66,044 |
| 2020 | $2,174 | $66,620 | $14,316 | $52,304 |
| 2019 | $2,183 | $66,620 | $14,316 | $52,304 |
| 2018 | $2,183 | $66,620 | $14,316 | $52,304 |
| 2017 | $2,881 | $66,620 | $14,316 | $52,304 |
| 2016 | $2,381 | $57,722 | $10,403 | $47,319 |
| 2015 | $2,384 | $57,722 | $10,403 | $47,319 |
| 2014 | $2,387 | $57,722 | $10,403 | $47,319 |
| 2013 | -- | $57,722 | $10,403 | $47,319 |
Source: Public Records
Map
Nearby Homes
- 5408 Old Dominion Rd
- 5324 Colony Dr
- 5422 Colony Dr
- 5966 Fornof Rd
- 6127 Stony Creek Dr
- 5791 Bishop Dr
- 5028 Warm Springs Rd
- 6137 Stoneway Dr
- 6263 Potomac Cir
- 6333 Stony Creek Dr
- 5378 Misty Ln
- 5804 Dearborn Ave
- 6 Jamestown Ct
- 6251 Rockefeller Dr
- 5623 Hodges Dr
- 5621 Hodges Dr
- 5619 Hodges Dr
- 6222 Goodwin Dr
- 4847 Warm Springs Rd
- 5045 Old Post Rd
- 5389 McCaghren Dr
- 5381 McCaghren Dr
- 5390 McCaghren Dr
- 14 McCaghren Way
- 16 McCaghren Way
- 5386 McCaghren Dr
- 5382 McCaghren Dr
- 12 McCaghren Way
- 4 Wythe Ct
- 5378 McCaghren Dr
- 5261 McCaghren Dr Unit B
- 5261 McCaghren Dr Unit C
- 5261 McCaghren Dr
- 5261 McCaghren Dr Unit F
- 5261 McCaghren Dr Unit G
- 5261 McCaghren Dr Unit H
- 5326 Old Dominion Rd
- 10 McCaghren Way
- 5320 Old Dominion Rd
- 3 Wythe Ct