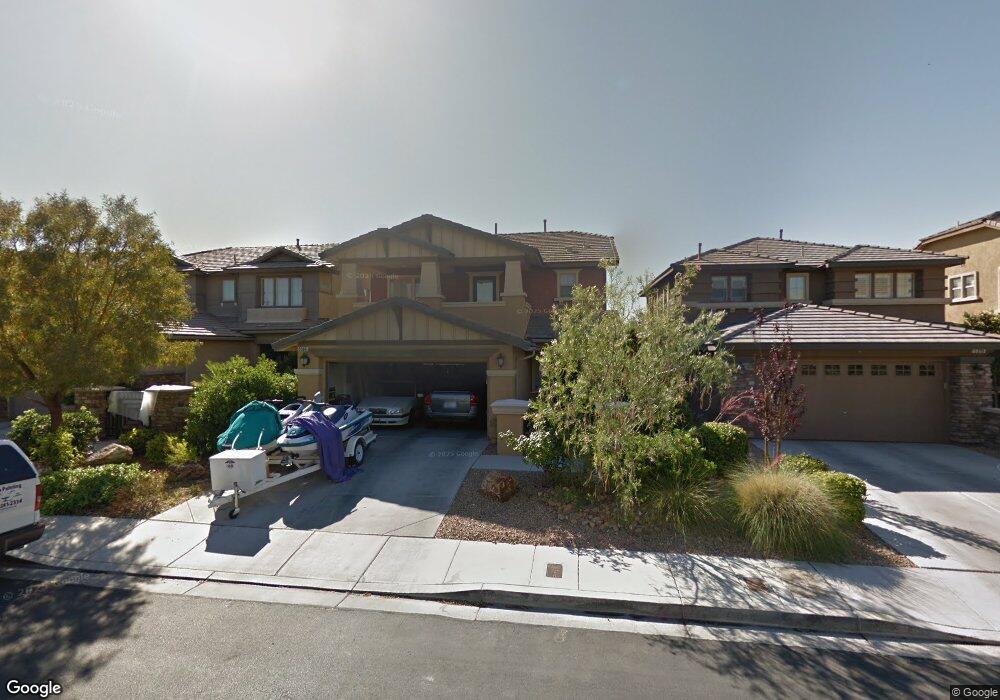
5386 Bristol Bend Ct Unit 1 Las Vegas, NV 89135
Summerlin NeighborhoodEstimated Value: $595,578
3
Beds
3
Baths
1,876
Sq Ft
$317/Sq Ft
Est. Value
About This Home
This home is located at 5386 Bristol Bend Ct Unit 1, Las Vegas, NV 89135 and is currently priced at $595,578, approximately $317 per square foot. 5386 Bristol Bend Ct Unit 1 is a home located in Clark County with nearby schools including Kathy L. Batterman Elementary School, Victoria Fertitta Middle School, and Durango High School.
Ownership History
Date
Name
Owned For
Owner Type
Purchase Details
Closed on
Apr 16, 2012
Sold by
Troisi Valerie
Bought by
Larson James
Current Estimated Value
Purchase Details
Closed on
Apr 13, 2012
Sold by
Larson James
Bought by
Xu Yuanjian and Wang Heather H
Purchase Details
Closed on
Feb 6, 2012
Sold by
Chueh Huiying
Bought by
Larson James
Purchase Details
Closed on
Jun 8, 2006
Sold by
Kb Home Nevada Inc
Bought by
Chueh Huiying
Home Financials for this Owner
Home Financials are based on the most recent Mortgage that was taken out on this home.
Original Mortgage
$339,741
Interest Rate
7.37%
Mortgage Type
Fannie Mae Freddie Mac
Create a Home Valuation Report for This Property
The Home Valuation Report is an in-depth analysis detailing your home's value as well as a comparison with similar homes in the area
Home Values in the Area
Average Home Value in this Area
Purchase History
| Date | Buyer | Sale Price | Title Company |
|---|---|---|---|
| Larson James | -- | Fidelity National Title Las | |
| Xu Yuanjian | $182,900 | Fidelity National Title Las | |
| Larson James | $156,500 | Fidelity National Title Las | |
| Chueh Huiying | $377,490 | First Amer Title Co Of Nv |
Source: Public Records
Mortgage History
| Date | Status | Borrower | Loan Amount |
|---|---|---|---|
| Previous Owner | Chueh Huiying | $339,741 |
Source: Public Records
Tax History Compared to Growth
Tax History
| Year | Tax Paid | Tax Assessment Tax Assessment Total Assessment is a certain percentage of the fair market value that is determined by local assessors to be the total taxable value of land and additions on the property. | Land | Improvement |
|---|---|---|---|---|
| 2025 | $3,330 | $152,410 | $62,300 | $90,110 |
| 2024 | $3,084 | $152,410 | $62,300 | $90,110 |
| 2023 | $3,084 | $131,230 | $45,850 | $85,380 |
| 2022 | $2,855 | $118,512 | $40,600 | $77,912 |
| 2021 | $2,643 | $109,219 | $35,350 | $73,869 |
| 2020 | $2,451 | $107,281 | $34,300 | $72,981 |
| 2019 | $2,295 | $102,323 | $30,800 | $71,523 |
| 2018 | $2,190 | $94,136 | $25,200 | $68,936 |
| 2017 | $2,769 | $94,077 | $24,500 | $69,577 |
| 2016 | $2,050 | $84,357 | $19,250 | $65,107 |
| 2015 | $2,046 | $72,815 | $16,450 | $56,365 |
| 2014 | $1,982 | $65,218 | $11,550 | $53,668 |
Source: Public Records
Map
Nearby Homes
- 5407 Bristol Bend Ct
- 5385 Bristol Bend Ct
- 5413 Bristol Bend Ct
- 5392 Candlespice Way
- 5430 Bristol Bend Ct
- 5445 Indian Cedar Dr
- 10680 Patina Hills Ct
- 10460 Harvest Wind Dr
- 5320 Fairbranch Ln
- 5492 Sentinel Point Ct
- 10637 Patina Hills Ct
- 10520 Maystar Ln
- 10420 Garland Grove Way
- 10481 Premia Place
- 5568 Trilling Bird Dr
- 10480 Premia Place
- 10404 Mystic Pine Rd
- 10748 Steel Ridge Ct
- 5201 Fading Sunset Dr
- 10437 Lyric Arbor Dr
- 5386 Bristol Bend Ct
- 5396 Bristol Bend Ct
- 5376 Bristol Bend Ct
- 5402 Bristol Bend Ct
- 5366 Bristol Bend Ct
- 5409 Nettle Way
- 5421 Nettle Way
- 5408 Bristol Bend Ct Unit n/a
- 5408 Bristol Bend Ct
- 5403 Nettle Way
- 5393 Bristol Bend Ct
- 5375 Bristol Bend Ct
- 5427 Nettle Way
- 5401 Bristol Bend Ct Unit n/a
- 5367 Bristol Bend Ct
- 5418 Bristol Bend Ct
- 5433 Nettle Way
- 10540 Harvest Wind Dr Unit none
- 10540 Harvest Wind Dr