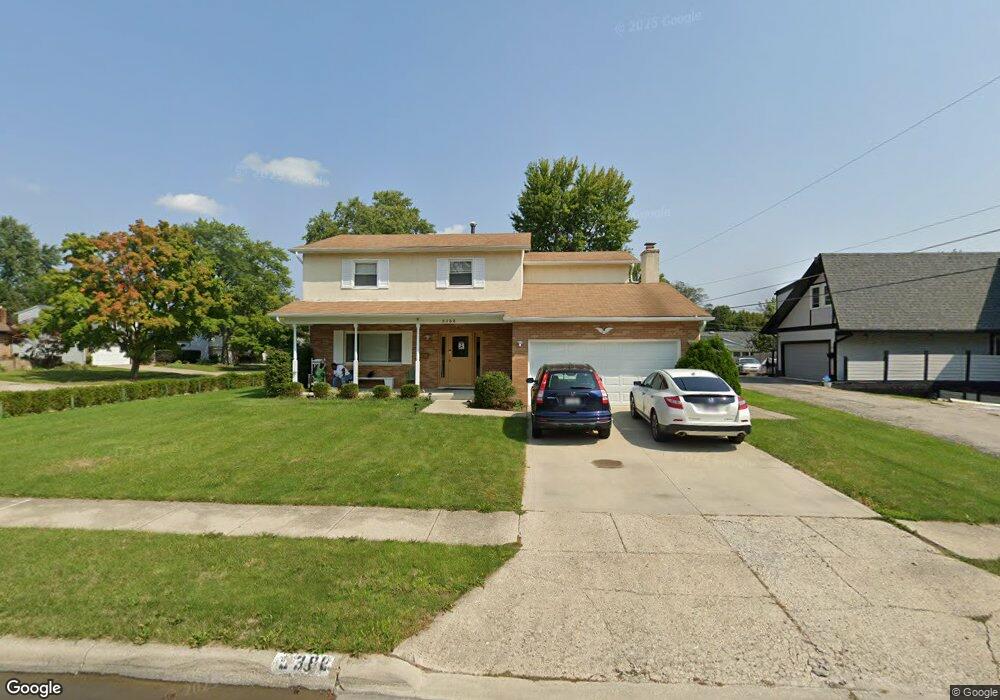
5388 Torchwood Loop E Columbus, OH 43229
Forest Park East NeighborhoodEstimated Value: $343,019 - $368,000
4
Beds
3
Baths
2,044
Sq Ft
$175/Sq Ft
Est. Value
About This Home
This home is located at 5388 Torchwood Loop E, Columbus, OH 43229 and is currently estimated at $357,505, approximately $174 per square foot. 5388 Torchwood Loop E is a home located in Franklin County with nearby schools including Parkmoor Elementary School, Woodward Park Middle School, and Northland High School.
Ownership History
Date
Name
Owned For
Owner Type
Purchase Details
Closed on
Sep 16, 2020
Sold by
Romney Errol and Romney Iiene
Bought by
Jalloh Mohamed and Jalloh Mariatu
Current Estimated Value
Home Financials for this Owner
Home Financials are based on the most recent Mortgage that was taken out on this home.
Original Mortgage
$240,950
Outstanding Balance
$211,876
Interest Rate
2.9%
Mortgage Type
Future Advance Clause Open End Mortgage
Estimated Equity
$145,630
Purchase Details
Closed on
Oct 12, 2007
Sold by
Hud
Bought by
Romney Errol and Romney Ilene
Purchase Details
Closed on
Mar 26, 2006
Sold by
Thomas Destiny L and Us Bank Na
Bought by
Hud
Purchase Details
Closed on
Jul 21, 2004
Sold by
Baker Christopher D and Baker April L
Bought by
Thomas Destiny L
Home Financials for this Owner
Home Financials are based on the most recent Mortgage that was taken out on this home.
Original Mortgage
$147,581
Interest Rate
6.42%
Mortgage Type
FHA
Create a Home Valuation Report for This Property
The Home Valuation Report is an in-depth analysis detailing your home's value as well as a comparison with similar homes in the area
Home Values in the Area
Average Home Value in this Area
Purchase History
| Date | Buyer | Sale Price | Title Company |
|---|---|---|---|
| Jalloh Mohamed | $249,900 | Access Title Agency | |
| Romney Errol | $115,500 | Talon Group | |
| Hud | $100,000 | None Available | |
| Thomas Destiny L | $149,900 | Valmer |
Source: Public Records
Mortgage History
| Date | Status | Borrower | Loan Amount |
|---|---|---|---|
| Open | Jalloh Mohamed | $240,950 | |
| Previous Owner | Thomas Destiny L | $147,581 |
Source: Public Records
Tax History
| Year | Tax Paid | Tax Assessment Tax Assessment Total Assessment is a certain percentage of the fair market value that is determined by local assessors to be the total taxable value of land and additions on the property. | Land | Improvement |
|---|---|---|---|---|
| 2025 | $4,736 | $105,530 | $21,140 | $84,390 |
| 2024 | $4,736 | $105,530 | $21,140 | $84,390 |
| 2023 | $4,676 | $105,530 | $21,140 | $84,390 |
| 2022 | $3,967 | $76,480 | $16,380 | $60,100 |
| 2021 | $3,974 | $76,480 | $16,380 | $60,100 |
| 2020 | $3,848 | $73,960 | $16,380 | $57,580 |
| 2019 | $3,264 | $53,800 | $12,150 | $41,650 |
| 2018 | $2,897 | $53,800 | $12,150 | $41,650 |
| 2017 | $3,028 | $53,800 | $12,150 | $41,650 |
| 2016 | $2,794 | $42,180 | $9,700 | $32,480 |
| 2015 | $2,536 | $42,180 | $9,700 | $32,480 |
| 2014 | $2,543 | $42,180 | $9,700 | $32,480 |
| 2013 | $1,377 | $46,305 | $10,220 | $36,085 |
Source: Public Records
Map
Nearby Homes
- 2087 Teakwood Dr
- 1862 Torchwood Dr
- 5726 Beechcroft Rd Unit J
- 5486 Pine Bluff Rd
- 5720 Beechcroft Rd Unit B
- 5732 Beechcroft Rd Unit B
- 5556 Parkshire Dr Unit 5556
- 2251 Tuliptree Ave
- 5705 Pine Tree St S Unit F
- 1687 Brookfield Square S
- 1638 Arrowood Loop N
- 5092 Riverbirch Dr N
- 5575 Karl Rd
- 5885 Beechcroft Rd Unit 306
- 5885 Beechcroft Rd Unit 114
- 4979 Lyle Rd
- 5352 Hazelwood Rd
- 2162 Trent Rd
- 5524 Driftwood Rd
- 1523 Hempwood Dr
- 5382 Torchwood Loop E
- 5406 Maple Canyon Ave
- 5372 Torchwood Loop E
- 2071 Teakwood Dr
- 5409 Maple Canyon Ave
- 5401 Maple Canyon Ave
- 5387 Torchwood Loop E
- 2079 Teakwood Dr
- 5381 Torchwood Loop E
- 5415 Maple Canyon Ave
- 5395 Maple Canyon Ave
- 5366 Torchwood Loop E
- 5369 Torchwood Loop E
- 5419 Maple Canyon Ave
- 5389 Maple Canyon Ave
- 5360 Torchwood Loop E
- 5425 Maple Canyon Ave
- 5359 Torchwood Loop E
- 5436 Aspen Rd
- 2068 Teakwood Dr
Your Personal Tour Guide
Ask me questions while you tour the home.