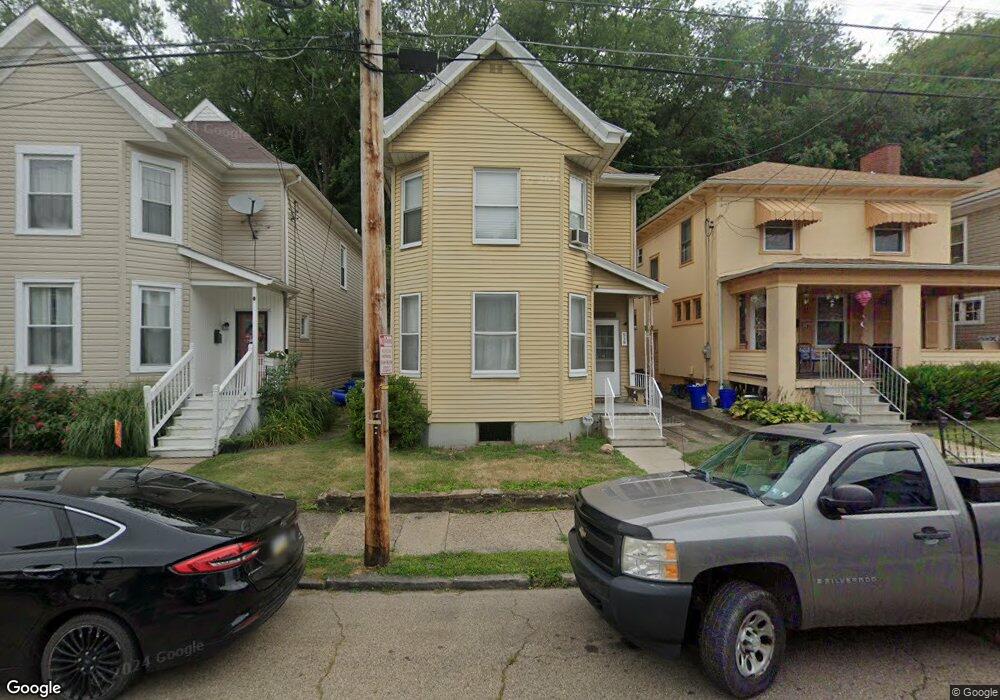
539 13th Ave New Brighton, PA 15066
Estimated Value: $58,000 - $121,000
3
Beds
1
Bath
1,520
Sq Ft
$63/Sq Ft
Est. Value
About This Home
This home is located at 539 13th Ave, New Brighton, PA 15066 and is currently estimated at $96,019, approximately $63 per square foot. 539 13th Ave is a home located in Beaver County with nearby schools including New Brighton Elementary School, New Brighton Area Middle School, and New Brighton Area High School.
Ownership History
Date
Name
Owned For
Owner Type
Purchase Details
Closed on
Jan 16, 2002
Sold by
Mcquisten Eugene M
Bought by
Carr Ronald W
Current Estimated Value
Home Financials for this Owner
Home Financials are based on the most recent Mortgage that was taken out on this home.
Original Mortgage
$32,000
Outstanding Balance
$13,114
Interest Rate
7.08%
Mortgage Type
VA
Estimated Equity
$82,905
Purchase Details
Closed on
Mar 9, 2001
Sold by
Householder Ruth
Bought by
Mcquisten Eugene M
Create a Home Valuation Report for This Property
The Home Valuation Report is an in-depth analysis detailing your home's value as well as a comparison with similar homes in the area
Home Values in the Area
Average Home Value in this Area
Purchase History
| Date | Buyer | Sale Price | Title Company |
|---|---|---|---|
| Carr Ronald W | $32,000 | -- | |
| Mcquisten Eugene M | $30,000 | -- |
Source: Public Records
Mortgage History
| Date | Status | Borrower | Loan Amount |
|---|---|---|---|
| Open | Carr Ronald W | $32,000 |
Source: Public Records
Tax History Compared to Growth
Tax History
| Year | Tax Paid | Tax Assessment Tax Assessment Total Assessment is a certain percentage of the fair market value that is determined by local assessors to be the total taxable value of land and additions on the property. | Land | Improvement |
|---|---|---|---|---|
| 2025 | $419 | $37,500 | $9,700 | $27,800 |
| 2024 | $1,532 | $37,500 | $9,700 | $27,800 |
| 2023 | $1,955 | $15,400 | $2,900 | $12,500 |
| 2022 | $1,955 | $15,400 | $2,900 | $12,500 |
| 2021 | $1,932 | $15,400 | $2,900 | $12,500 |
| 2020 | $1,881 | $15,400 | $2,900 | $12,500 |
| 2019 | $1,850 | $15,400 | $2,900 | $12,500 |
| 2018 | $1,778 | $15,400 | $2,900 | $12,500 |
| 2017 | $1,778 | $15,400 | $2,900 | $12,500 |
| 2016 | $1,686 | $15,400 | $2,900 | $12,500 |
| 2015 | $342 | $15,400 | $2,900 | $12,500 |
| 2014 | $342 | $15,400 | $2,900 | $12,500 |
Source: Public Records
Map
Nearby Homes