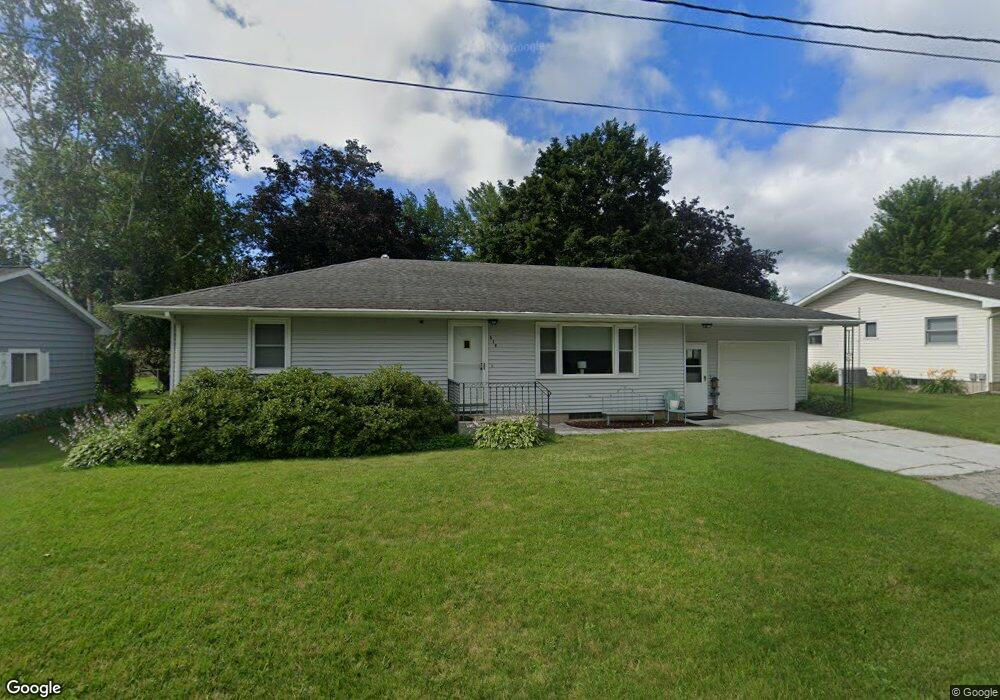
539 2nd Ave E Coggon, IA 52218
Estimated Value: $145,000 - $193,000
2
Beds
2
Baths
1,372
Sq Ft
$124/Sq Ft
Est. Value
About This Home
This home is located at 539 2nd Ave E, Coggon, IA 52218 and is currently estimated at $170,430, approximately $124 per square foot. 539 2nd Ave E is a home located in Linn County with nearby schools including North Linn Elementary School, North-Linn Middle School, and North-Linn Senior High School.
Ownership History
Date
Name
Owned For
Owner Type
Purchase Details
Closed on
Mar 17, 2019
Sold by
Finger Adam T and Finger Nicole L
Bought by
Betenbender Max
Current Estimated Value
Purchase Details
Closed on
Oct 1, 2012
Sold by
Warnock Martha R
Bought by
Ondler Jennifer L
Home Financials for this Owner
Home Financials are based on the most recent Mortgage that was taken out on this home.
Original Mortgage
$70,800
Interest Rate
3.66%
Mortgage Type
New Conventional
Create a Home Valuation Report for This Property
The Home Valuation Report is an in-depth analysis detailing your home's value as well as a comparison with similar homes in the area
Purchase History
| Date | Buyer | Sale Price | Title Company |
|---|---|---|---|
| Betenbender Max | $60,000 | None Available | |
| Ondler Jennifer L | $88,500 | None Available |
Source: Public Records
Mortgage History
| Date | Status | Borrower | Loan Amount |
|---|---|---|---|
| Previous Owner | Ondler Jennifer L | $70,800 |
Source: Public Records
Tax History
| Year | Tax Paid | Tax Assessment Tax Assessment Total Assessment is a certain percentage of the fair market value that is determined by local assessors to be the total taxable value of land and additions on the property. | Land | Improvement |
|---|---|---|---|---|
| 2025 | $2,660 | $188,600 | $19,300 | $169,300 |
| 2024 | $2,262 | $179,300 | $19,300 | $160,000 |
| 2023 | $2,262 | $179,300 | $19,300 | $160,000 |
| 2022 | $2,248 | $130,800 | $19,300 | $111,500 |
| 2021 | $2,114 | $130,800 | $19,300 | $111,500 |
| 2020 | $2,114 | $109,600 | $19,300 | $90,300 |
| 2019 | $1,956 | $107,000 | $19,300 | $87,700 |
Source: Public Records
Map
Nearby Homes
- 130 3rd Ave E
- 100 5th Ave Ct
- 321 3rd St S
- 403 3rd St S
- 113 E Vinton St
- 4903 Valley Farm Rd
- 4889 Valley Farm Rd
- 344 1st St N
- 626 Grove St
- 12 W Main St
- 56 North Ave
- 206 Belknap St
- 301 South St
- 0 Parcel: 03104-02001-00000 Unit 2502368
- 0 Jordans Grove Rd
- 0 Tbd Boy Scout Rd Unit 24471680
- 1350 Waubeek Rd
- TBD Boy Scouts Rd
- 3338 Troy Mills Blvd
- 3866 Whittier Rd
Your Personal Tour Guide
Ask me questions while you tour the home.